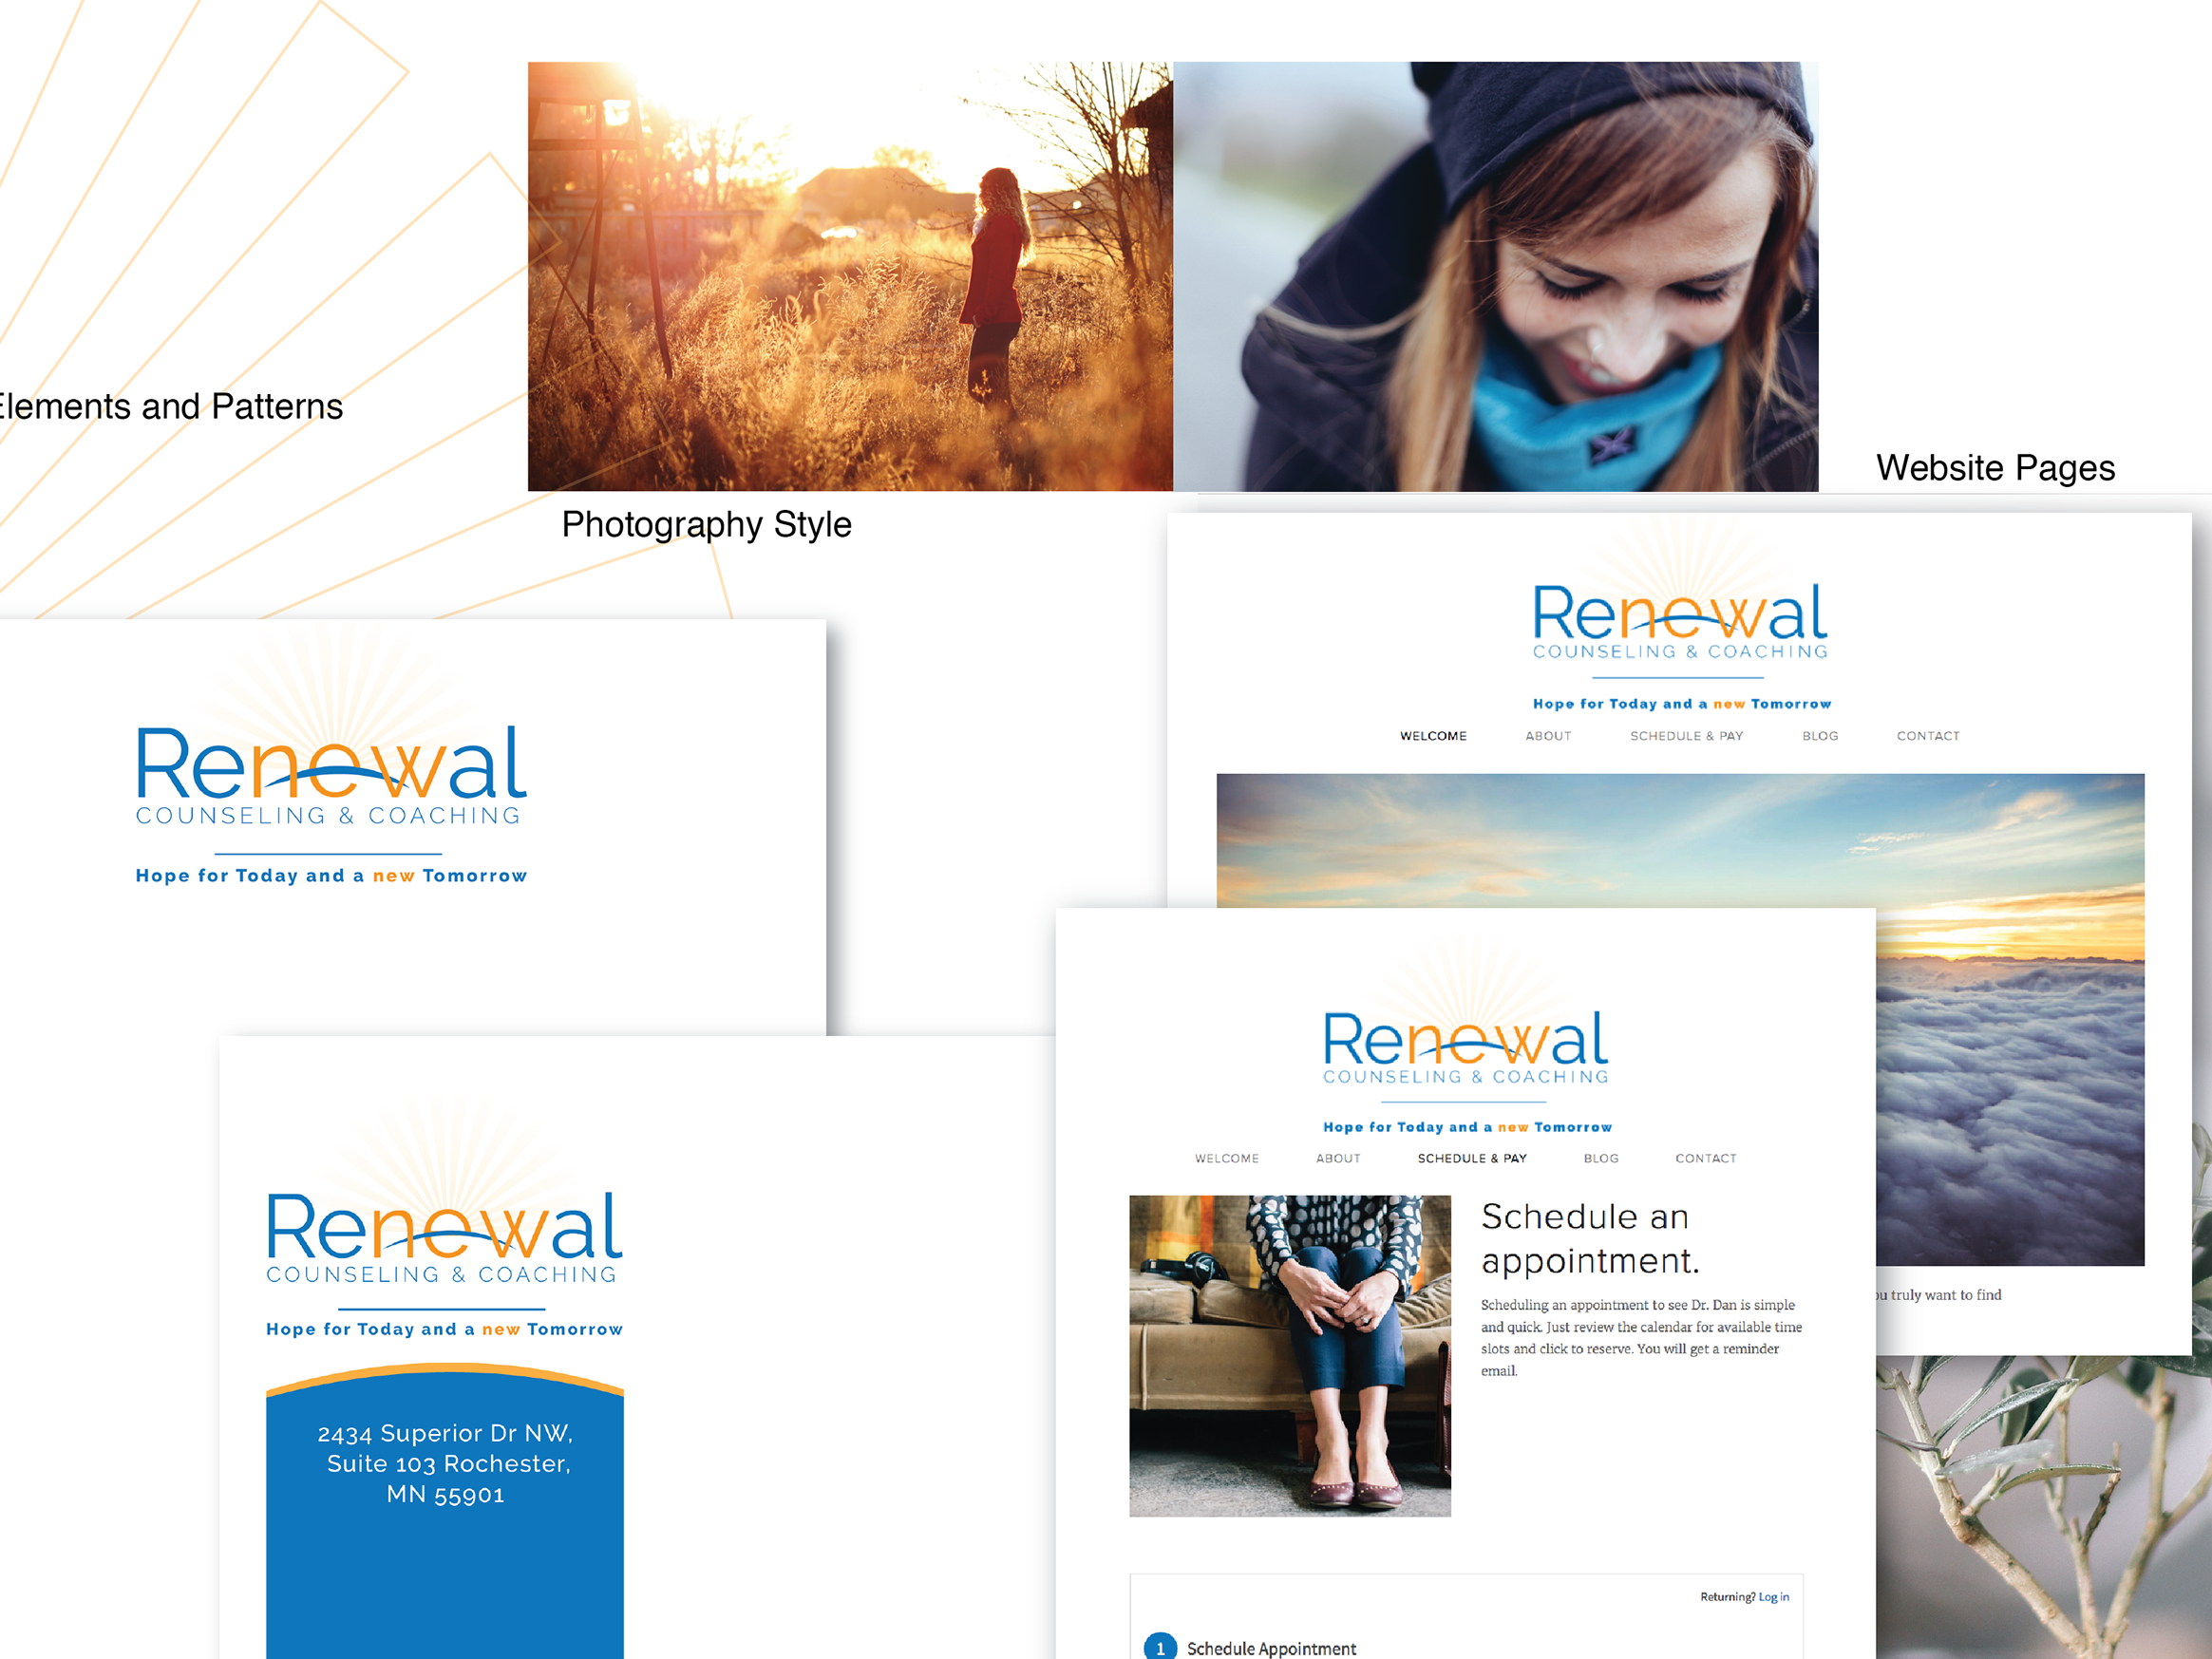
Infographics& Data Visualization: Infographics represent a unique form of design. Successfully visualizing concepts such as data sets, processes, timelines, and more is a rewarding challenge that I genuinely enjoy.
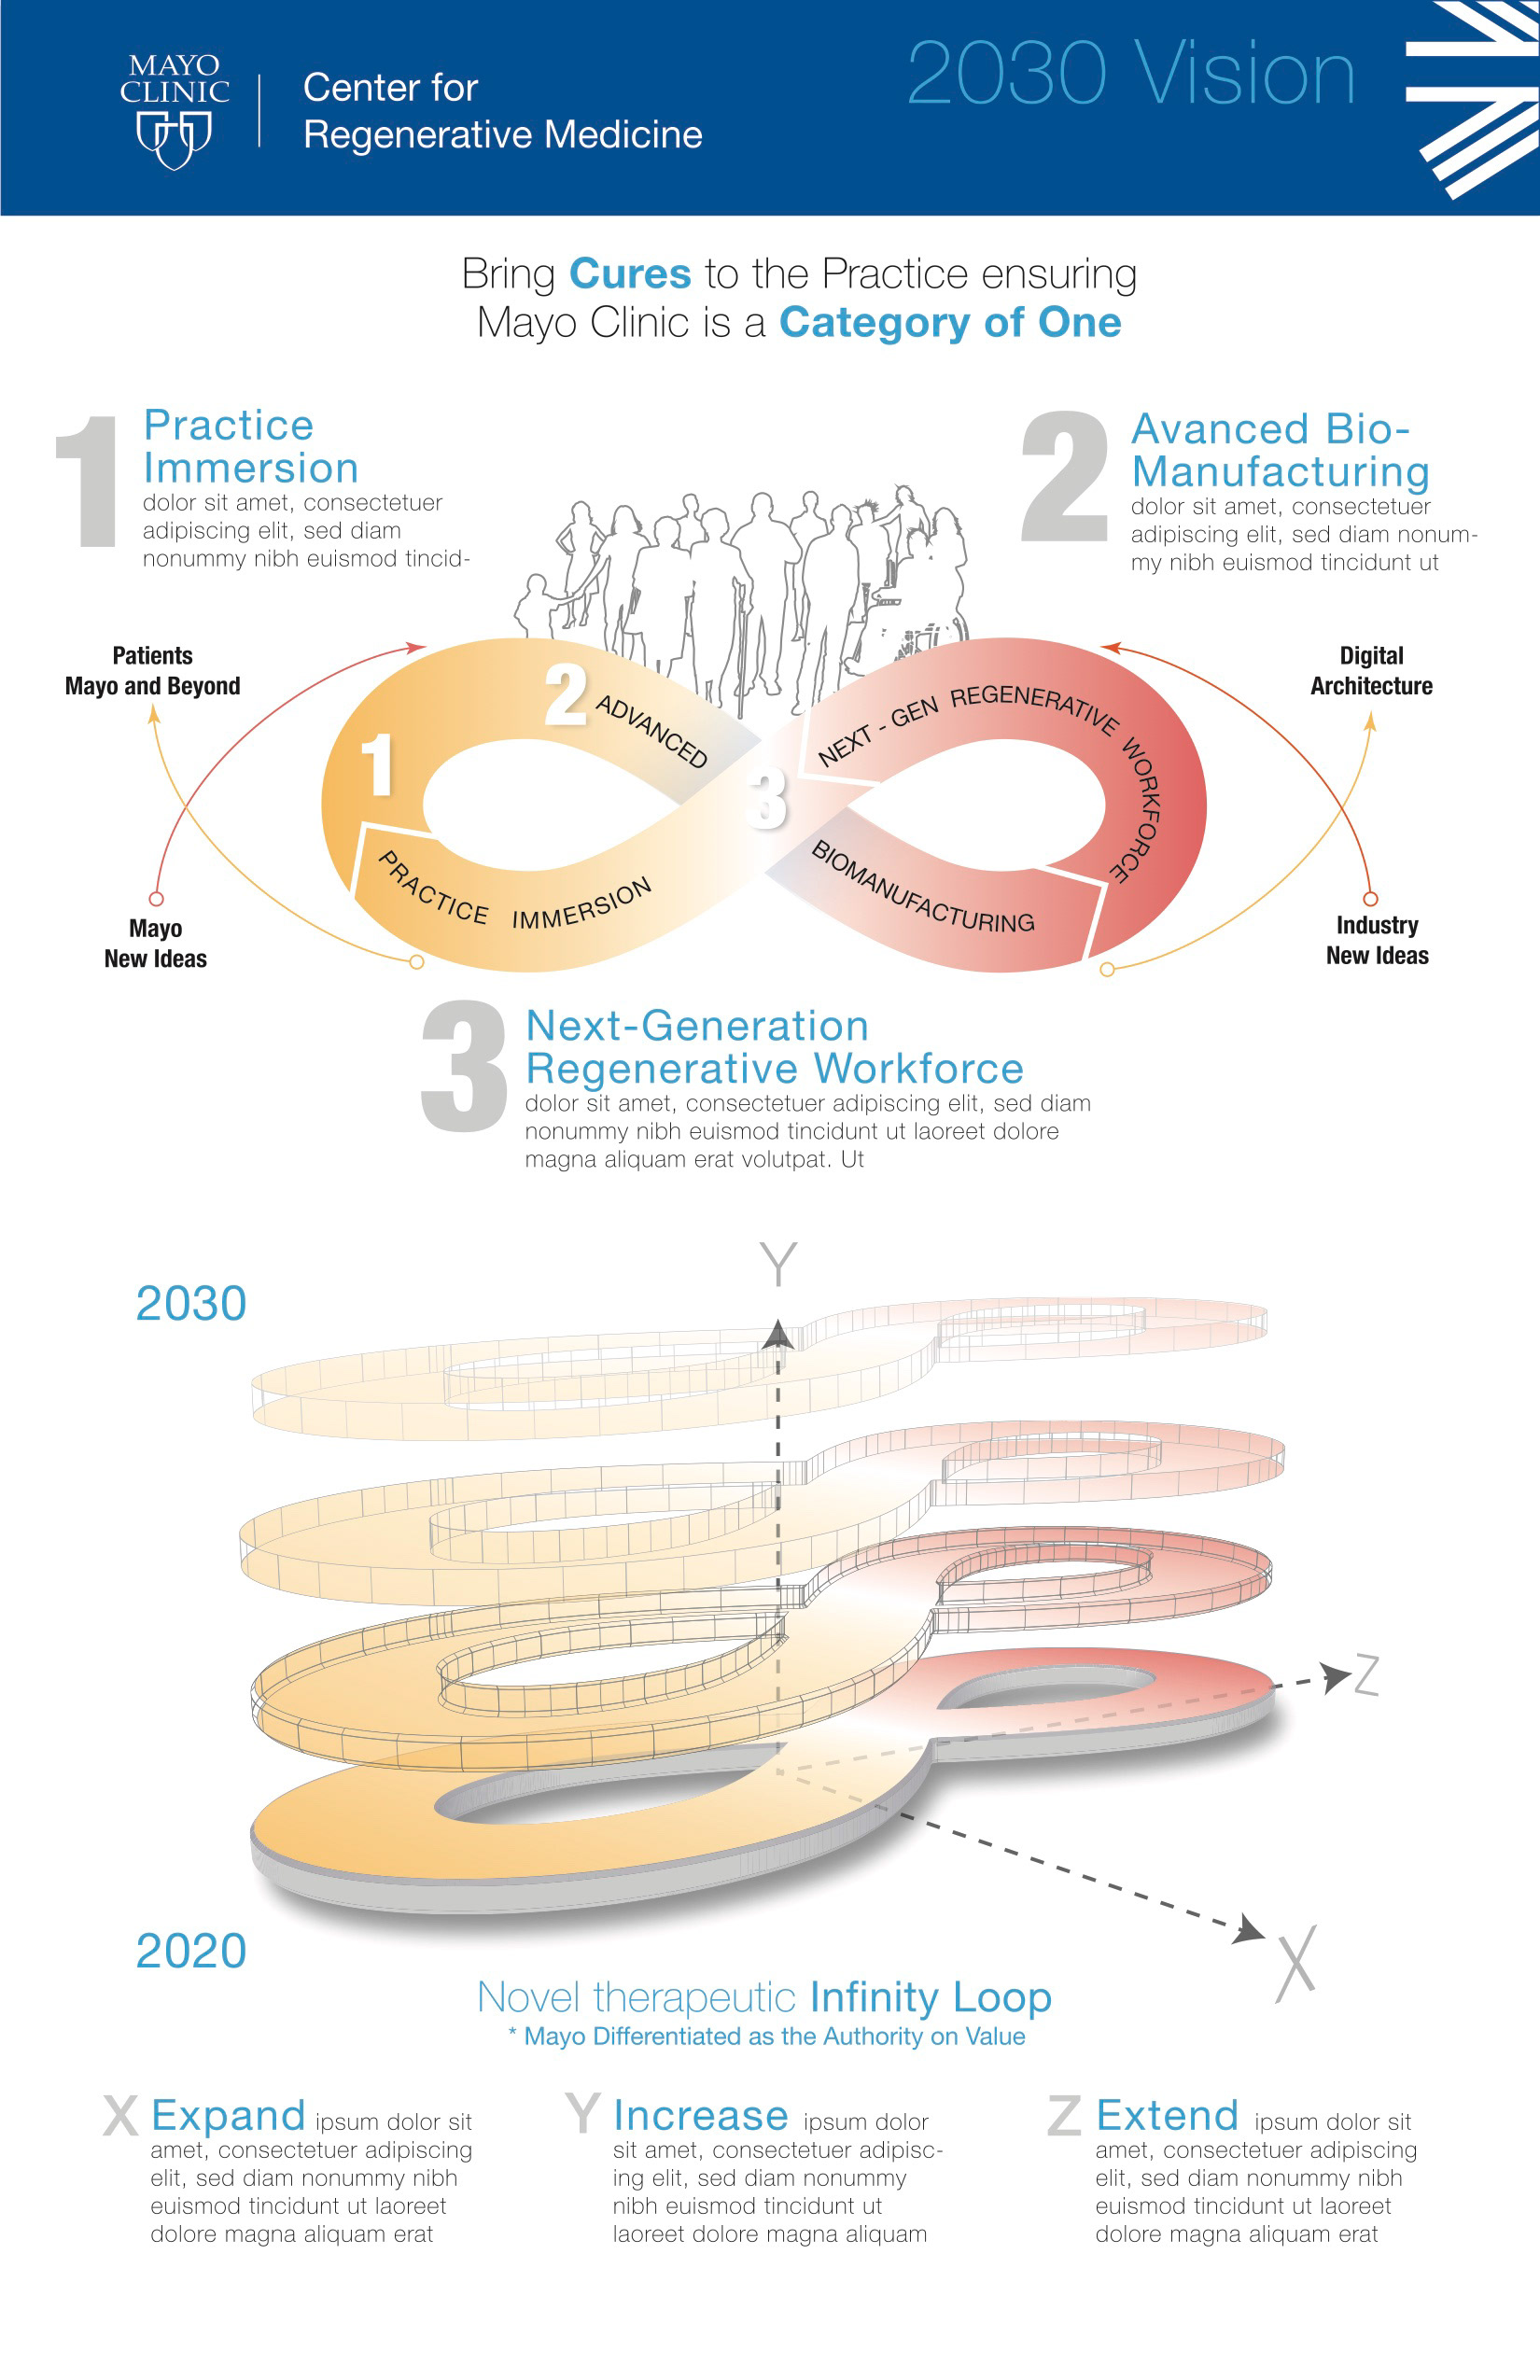
2030 Vision for Mayo Clinics Center of Regenerative Medicine
The Center for Regenerative Medicine leadership team requested that I create a visual representation of a self-reinforcing loop (above) to illustrate their business model and its benefits for patients for their 2030 vision. I opted for two perspectives: one from above and another in a three-dimensional format, highlighting the model's expanding nature.
Helping patients understand the confusing Glasgow Coma Scale.
Data visualization is crucial for enhancing understanding. At Mayo Clinic's Center for the Science of Healthcare Delivery, I designed decision-aid tools for patients considering expensive procedures.
For instance, parents often rush to request a CT scan for their child after a head injury, driven by anxiety and the confusing Glasgow Coma Scale, where a score of 1 signifies the worst case and 15 the best. Many focus on the higher score, missing its implications, which can lead to unnecessary scans.
To help, I created a short animation (above) that contextualized these scores. This approach alleviated parental anxiety, ensured CT scans were reserved for those in genuine need, and enhanced overall decision-making.
While working at the Mayo Clinic, I was approached by a breast health specialist who asked if I could use data visualization to help set expectations for patients undergoing a mammogram. She explained that patients who receive callbacks after a mammogram often experience undue anxiety. She wondered if I could develop a visual that would put the numbers into perspective. To address the problem, I created the animation above.
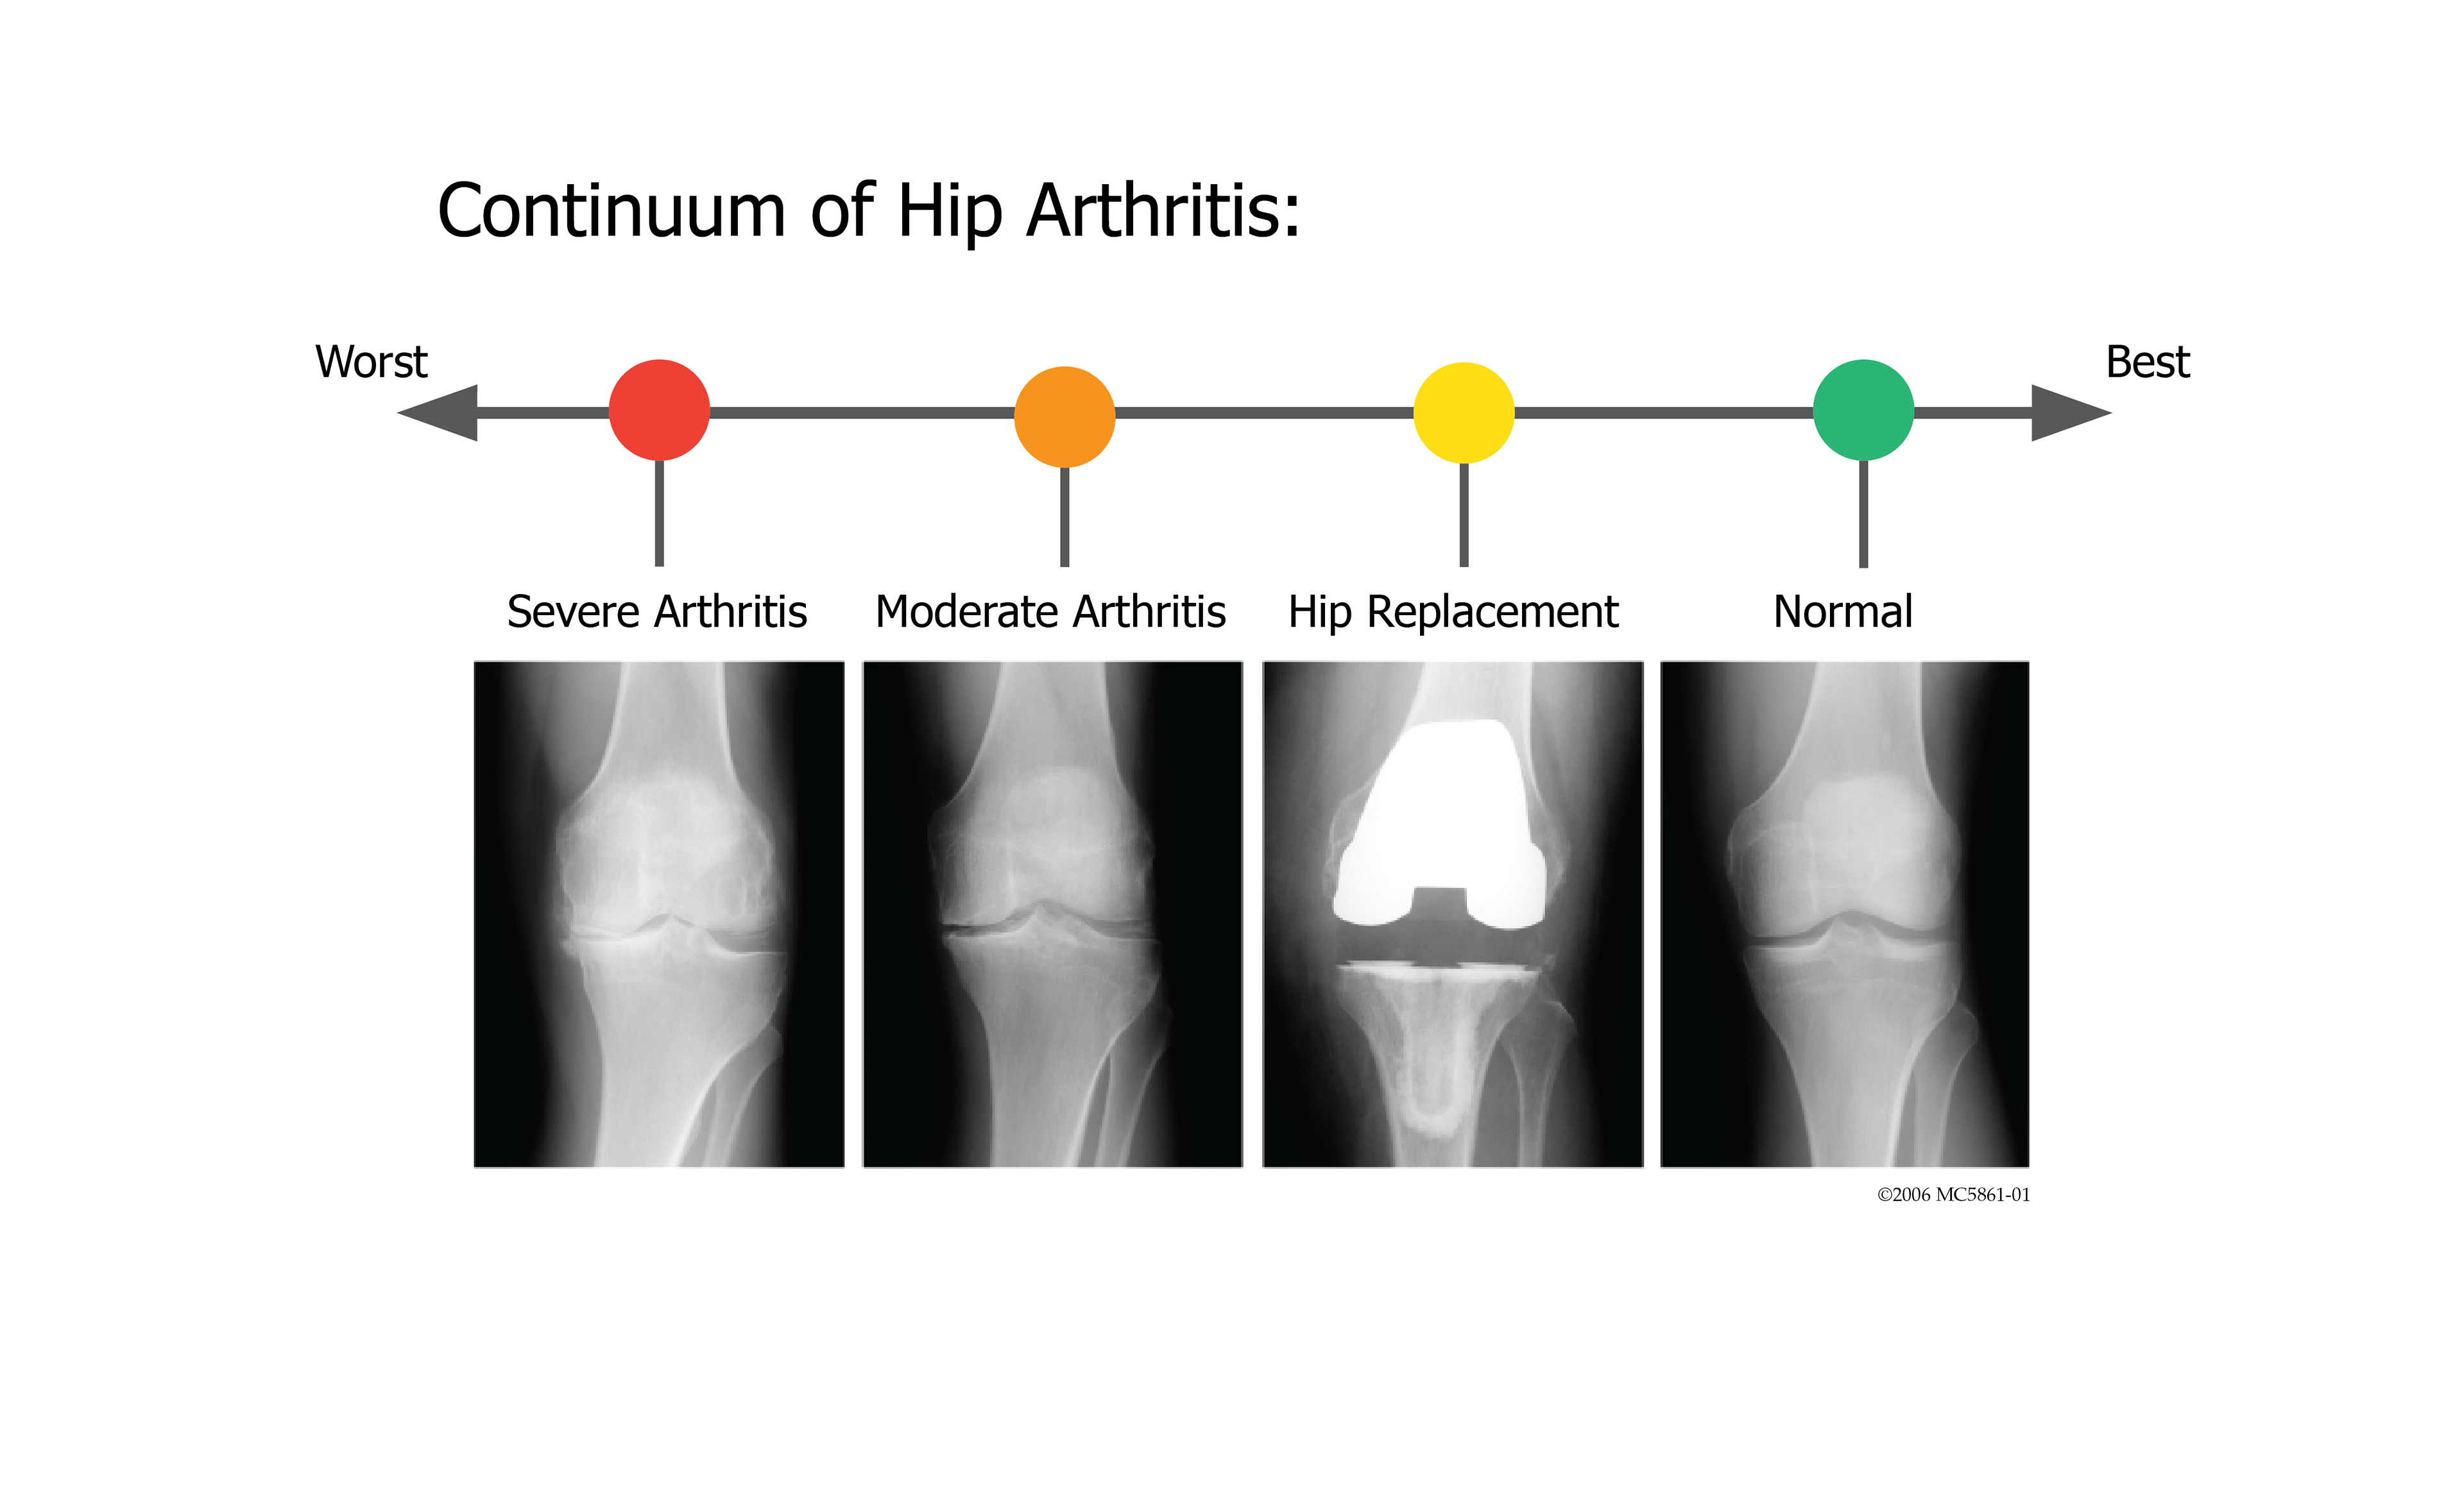
This image helps patients understand that their new hip will never be like a healthy normal hip.
Patients think of numbers and percentages differently. Visualizing increases understanding.
Visualization data is a great way help patients make an informed decision.
THR Decision aid tool
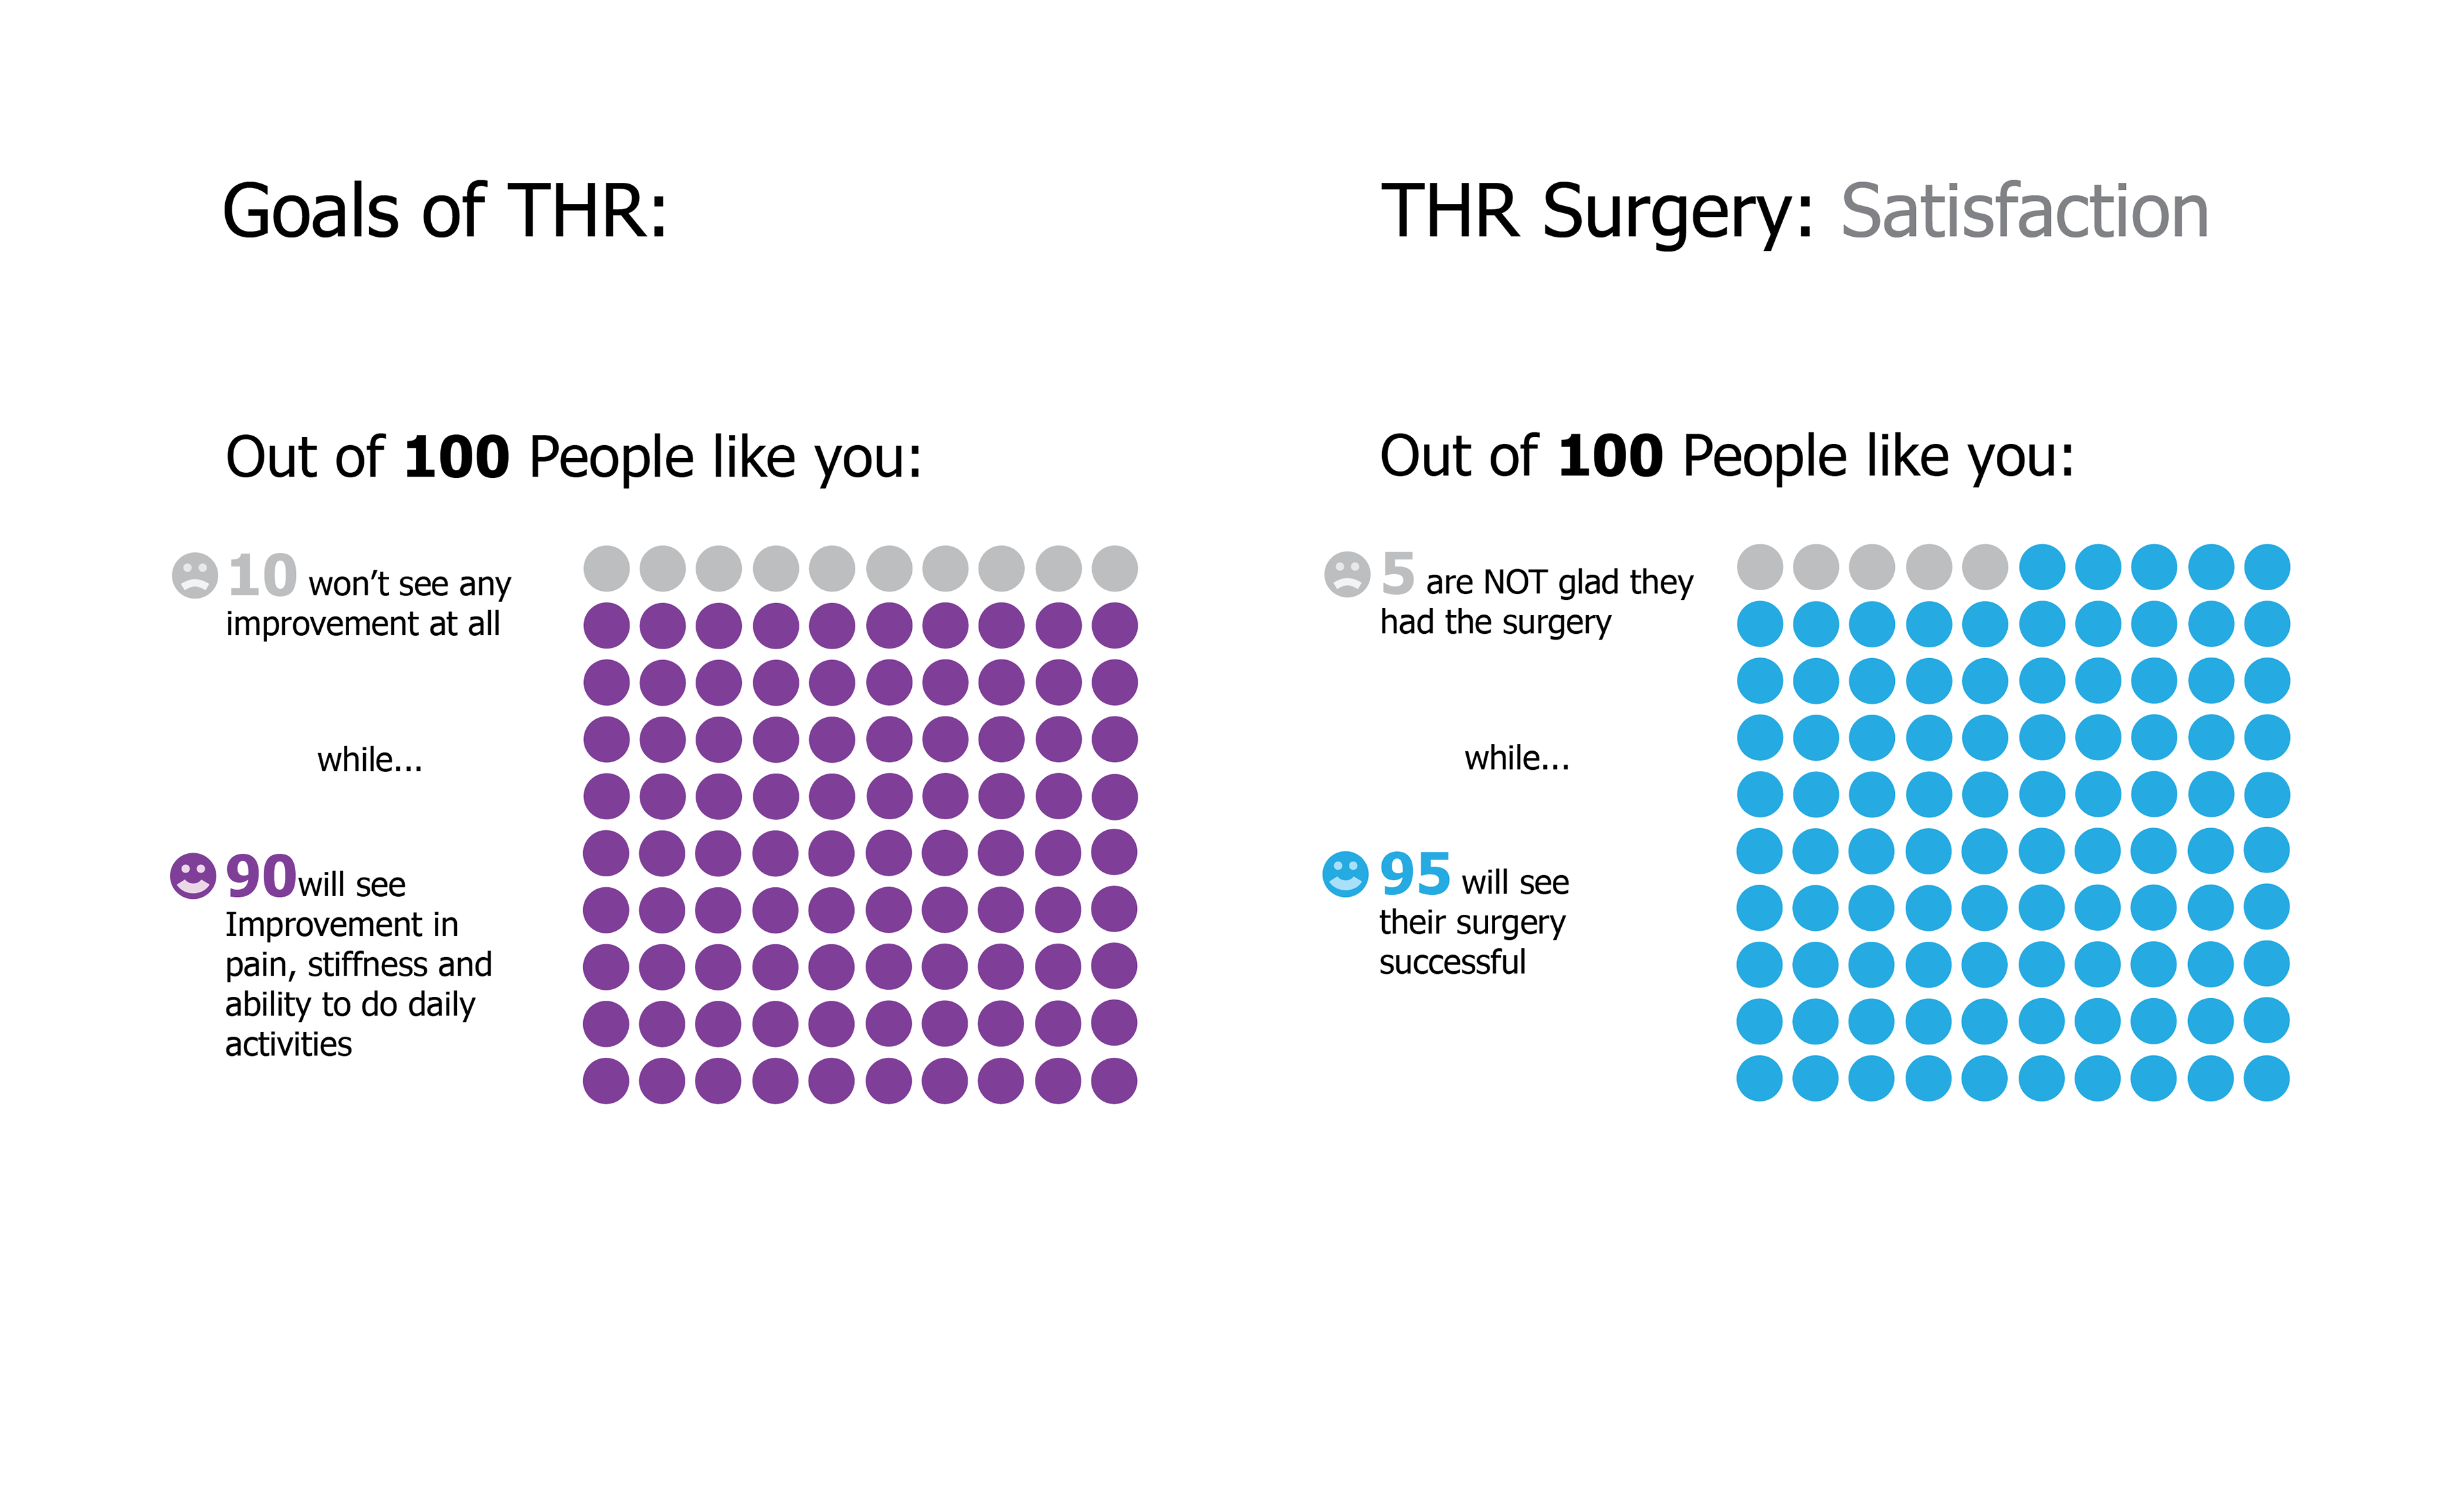
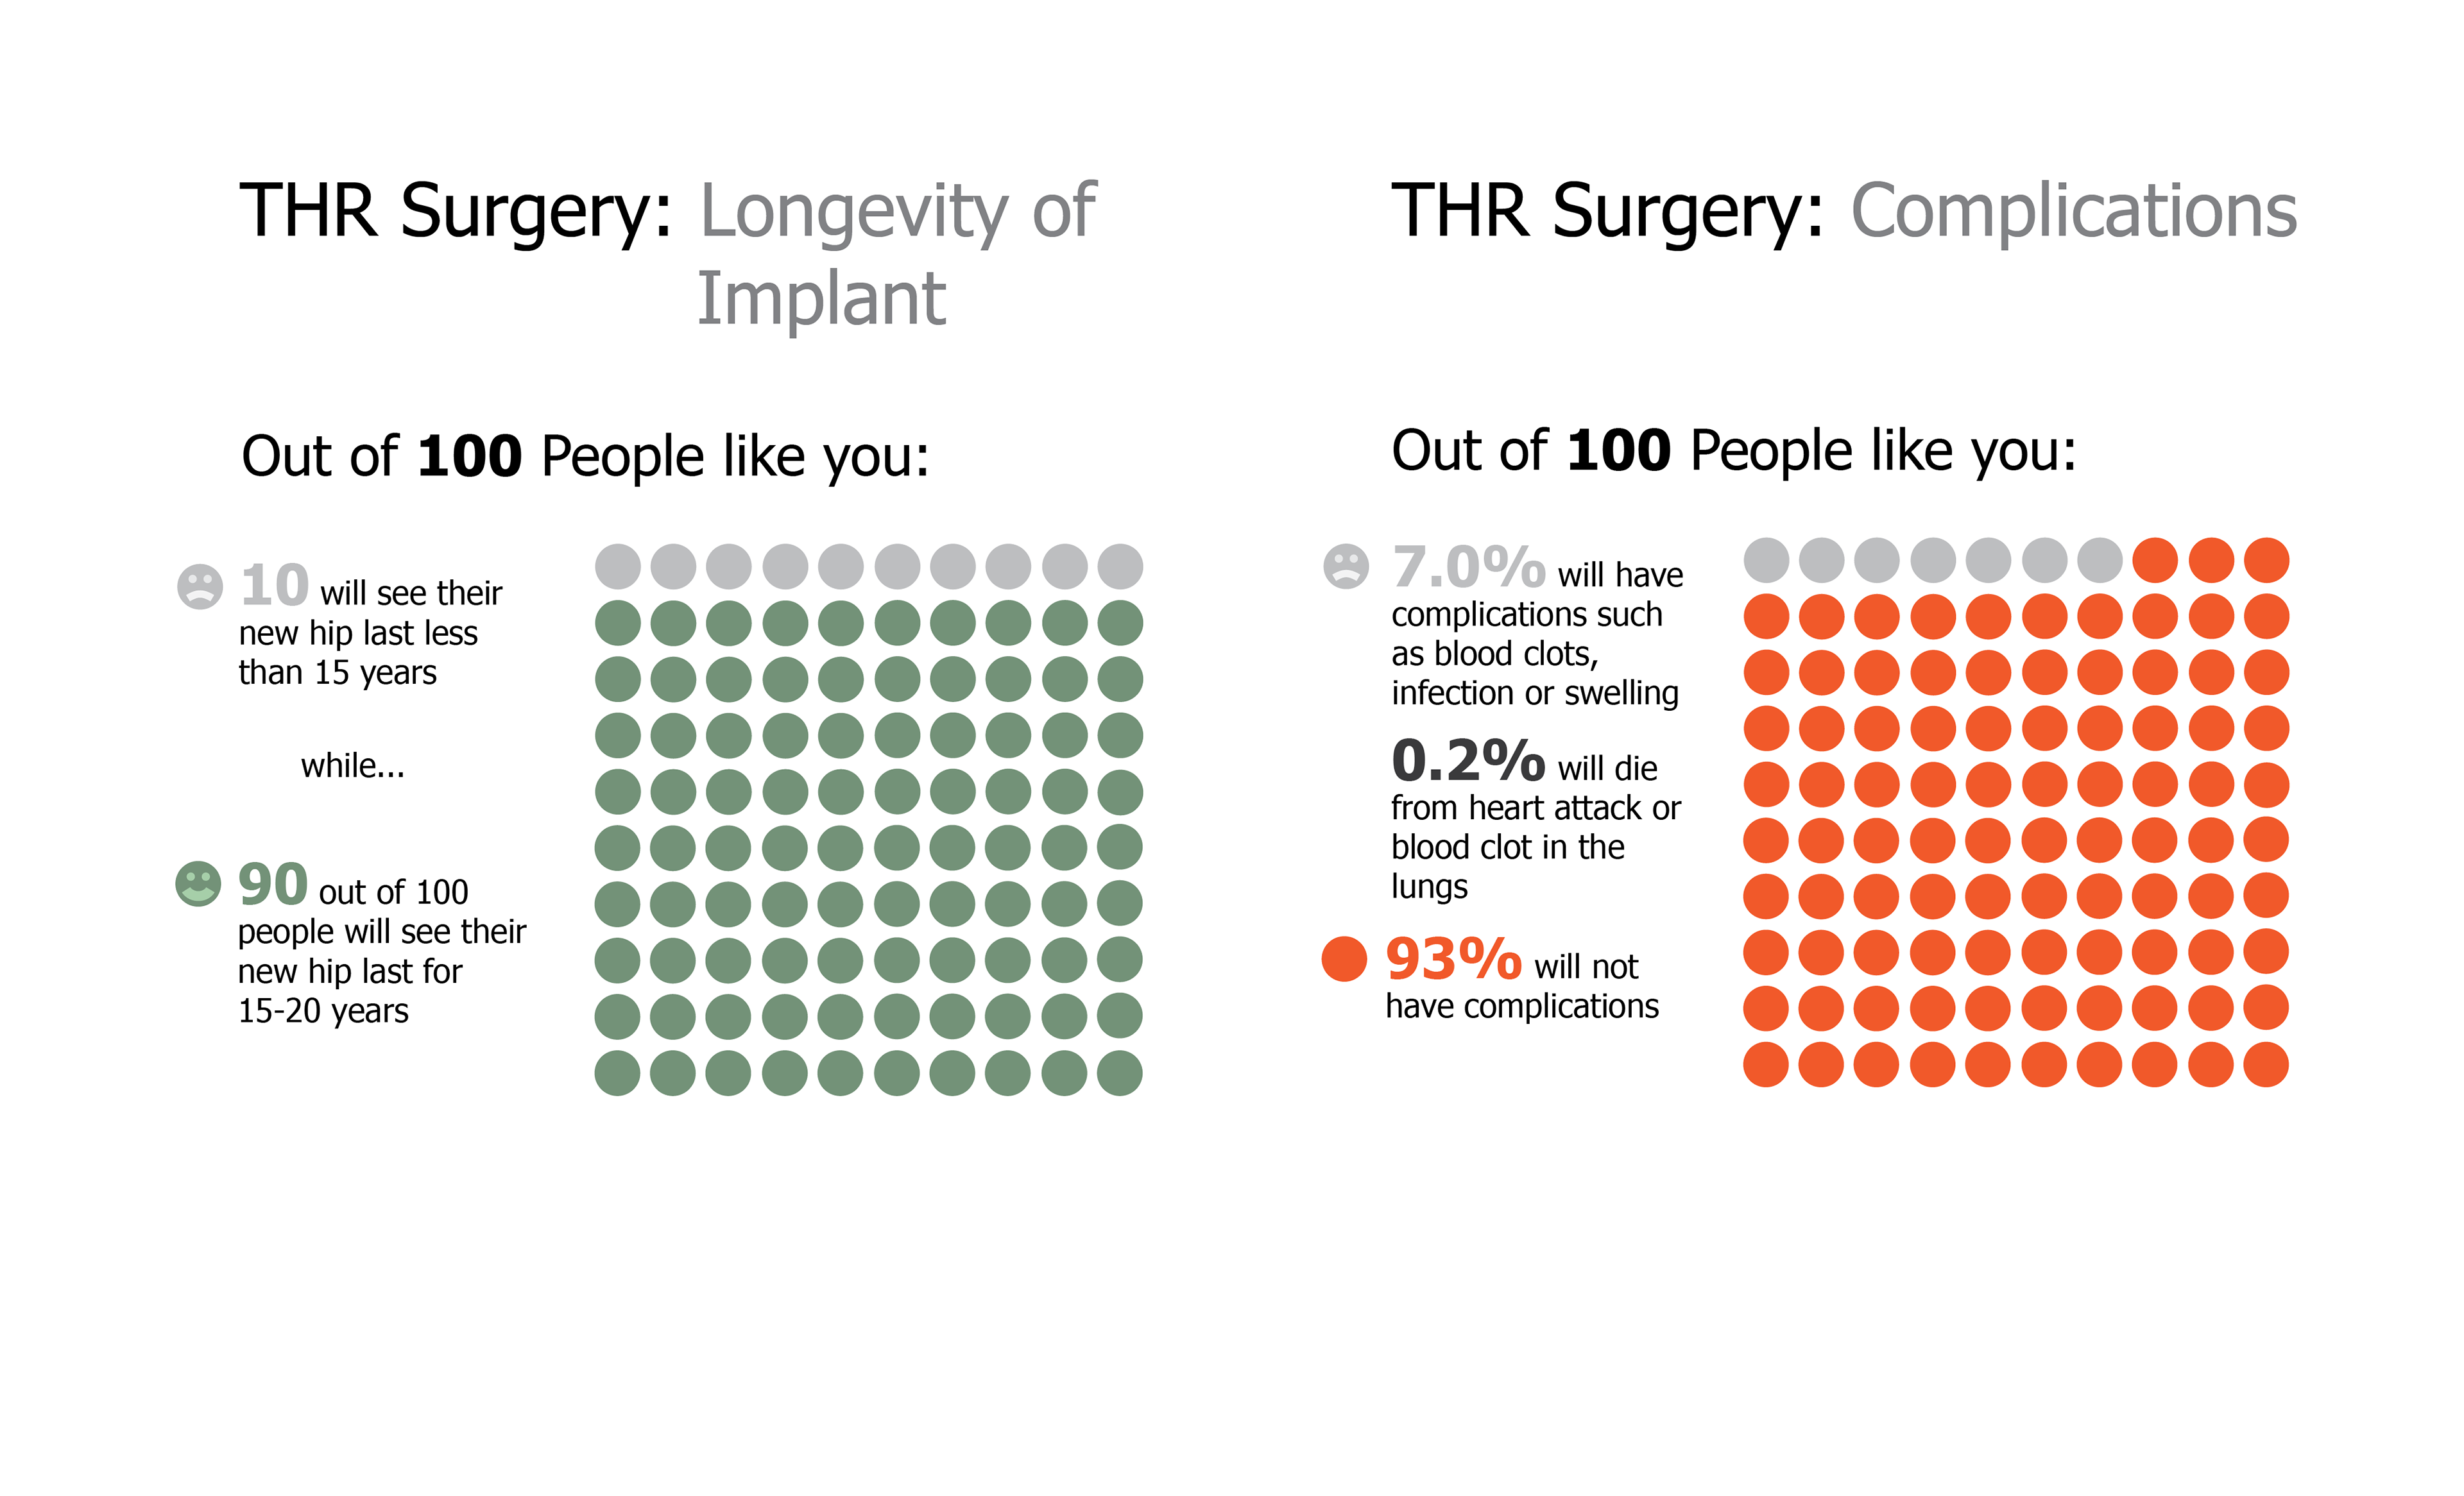
Total hip replacement (THR) has become a common procedure. Still, patients need to consider the timing of their life stage and the potential post-operative limitations before proceeding with this irreversible surgery. Since individuals interpret numbers differently, visualizing data can be a more effective way to convey important information.
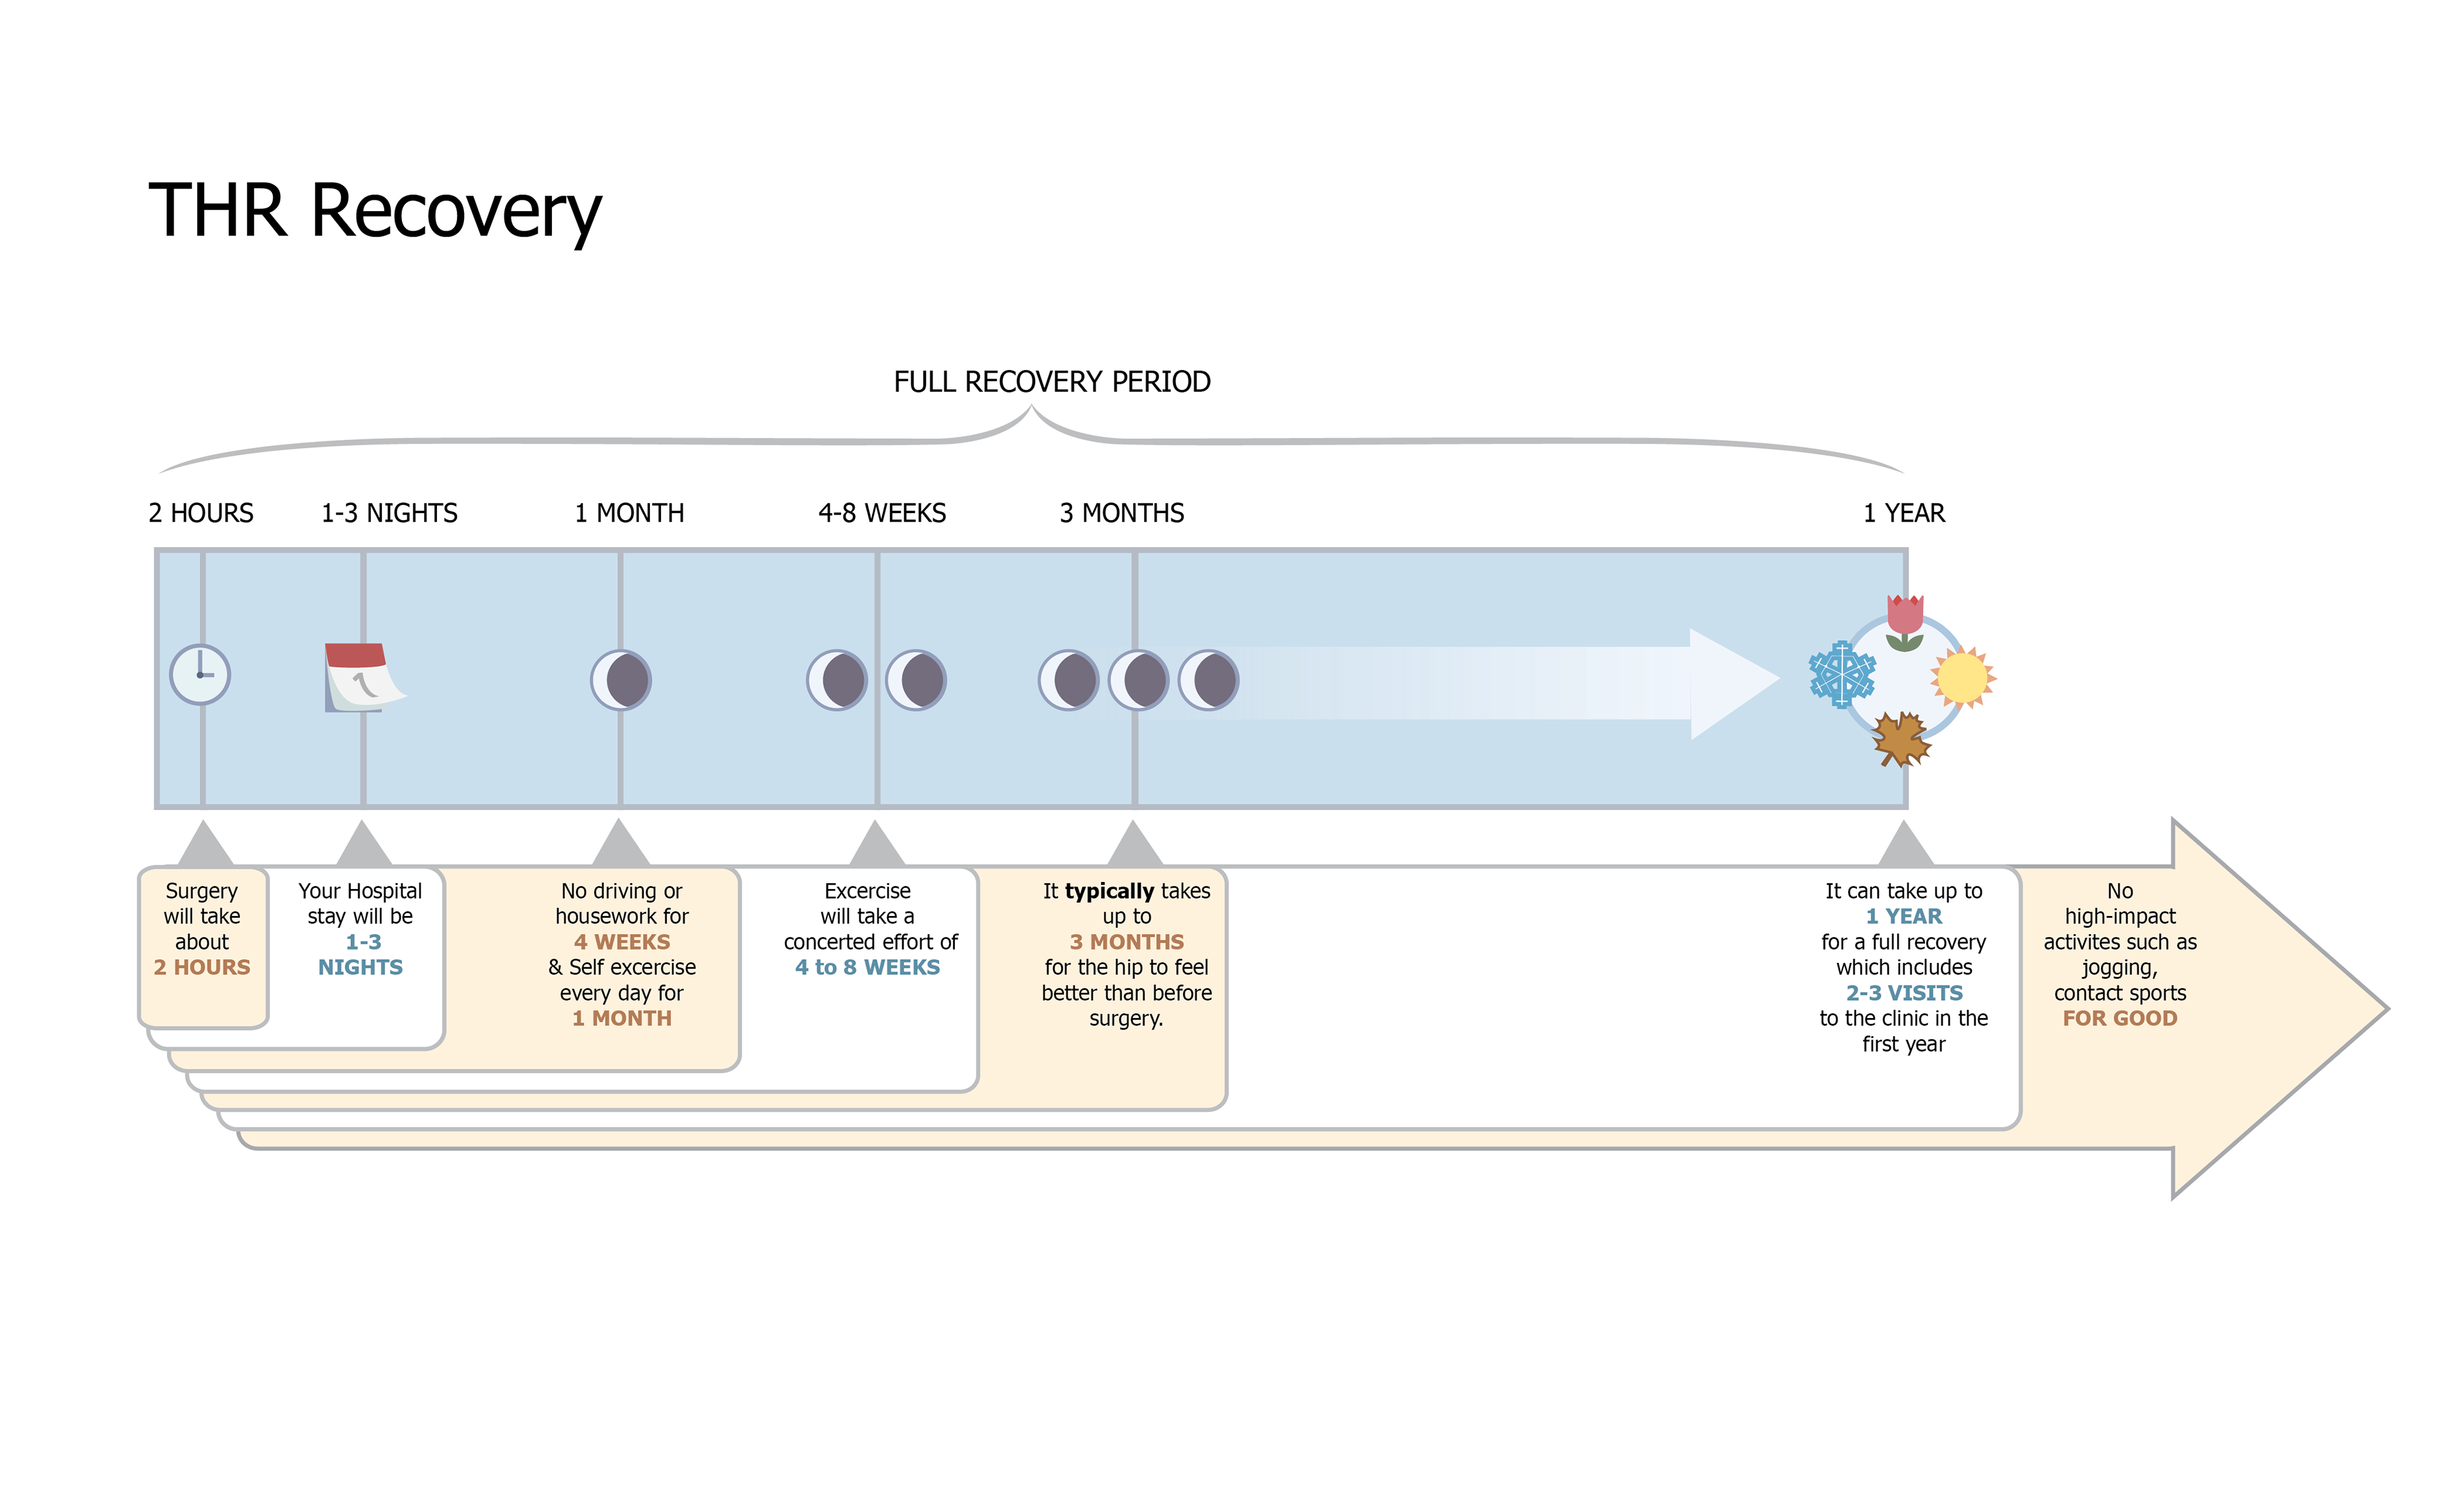
I created this series of information graphics above to help patients understand the risks associated with the procedure in terms of percentages. The final graphic acts as a one-page decision-aid tool to help patients grasp their recovery process and the limitations they may encounter after surgery.
The animation above was vital in showing how predictive analytics improves the patient journey at Mayo Clinic. Stakeholders wanted to visualize a typical patient journey and how efficiencies are created using data to adjust systems.
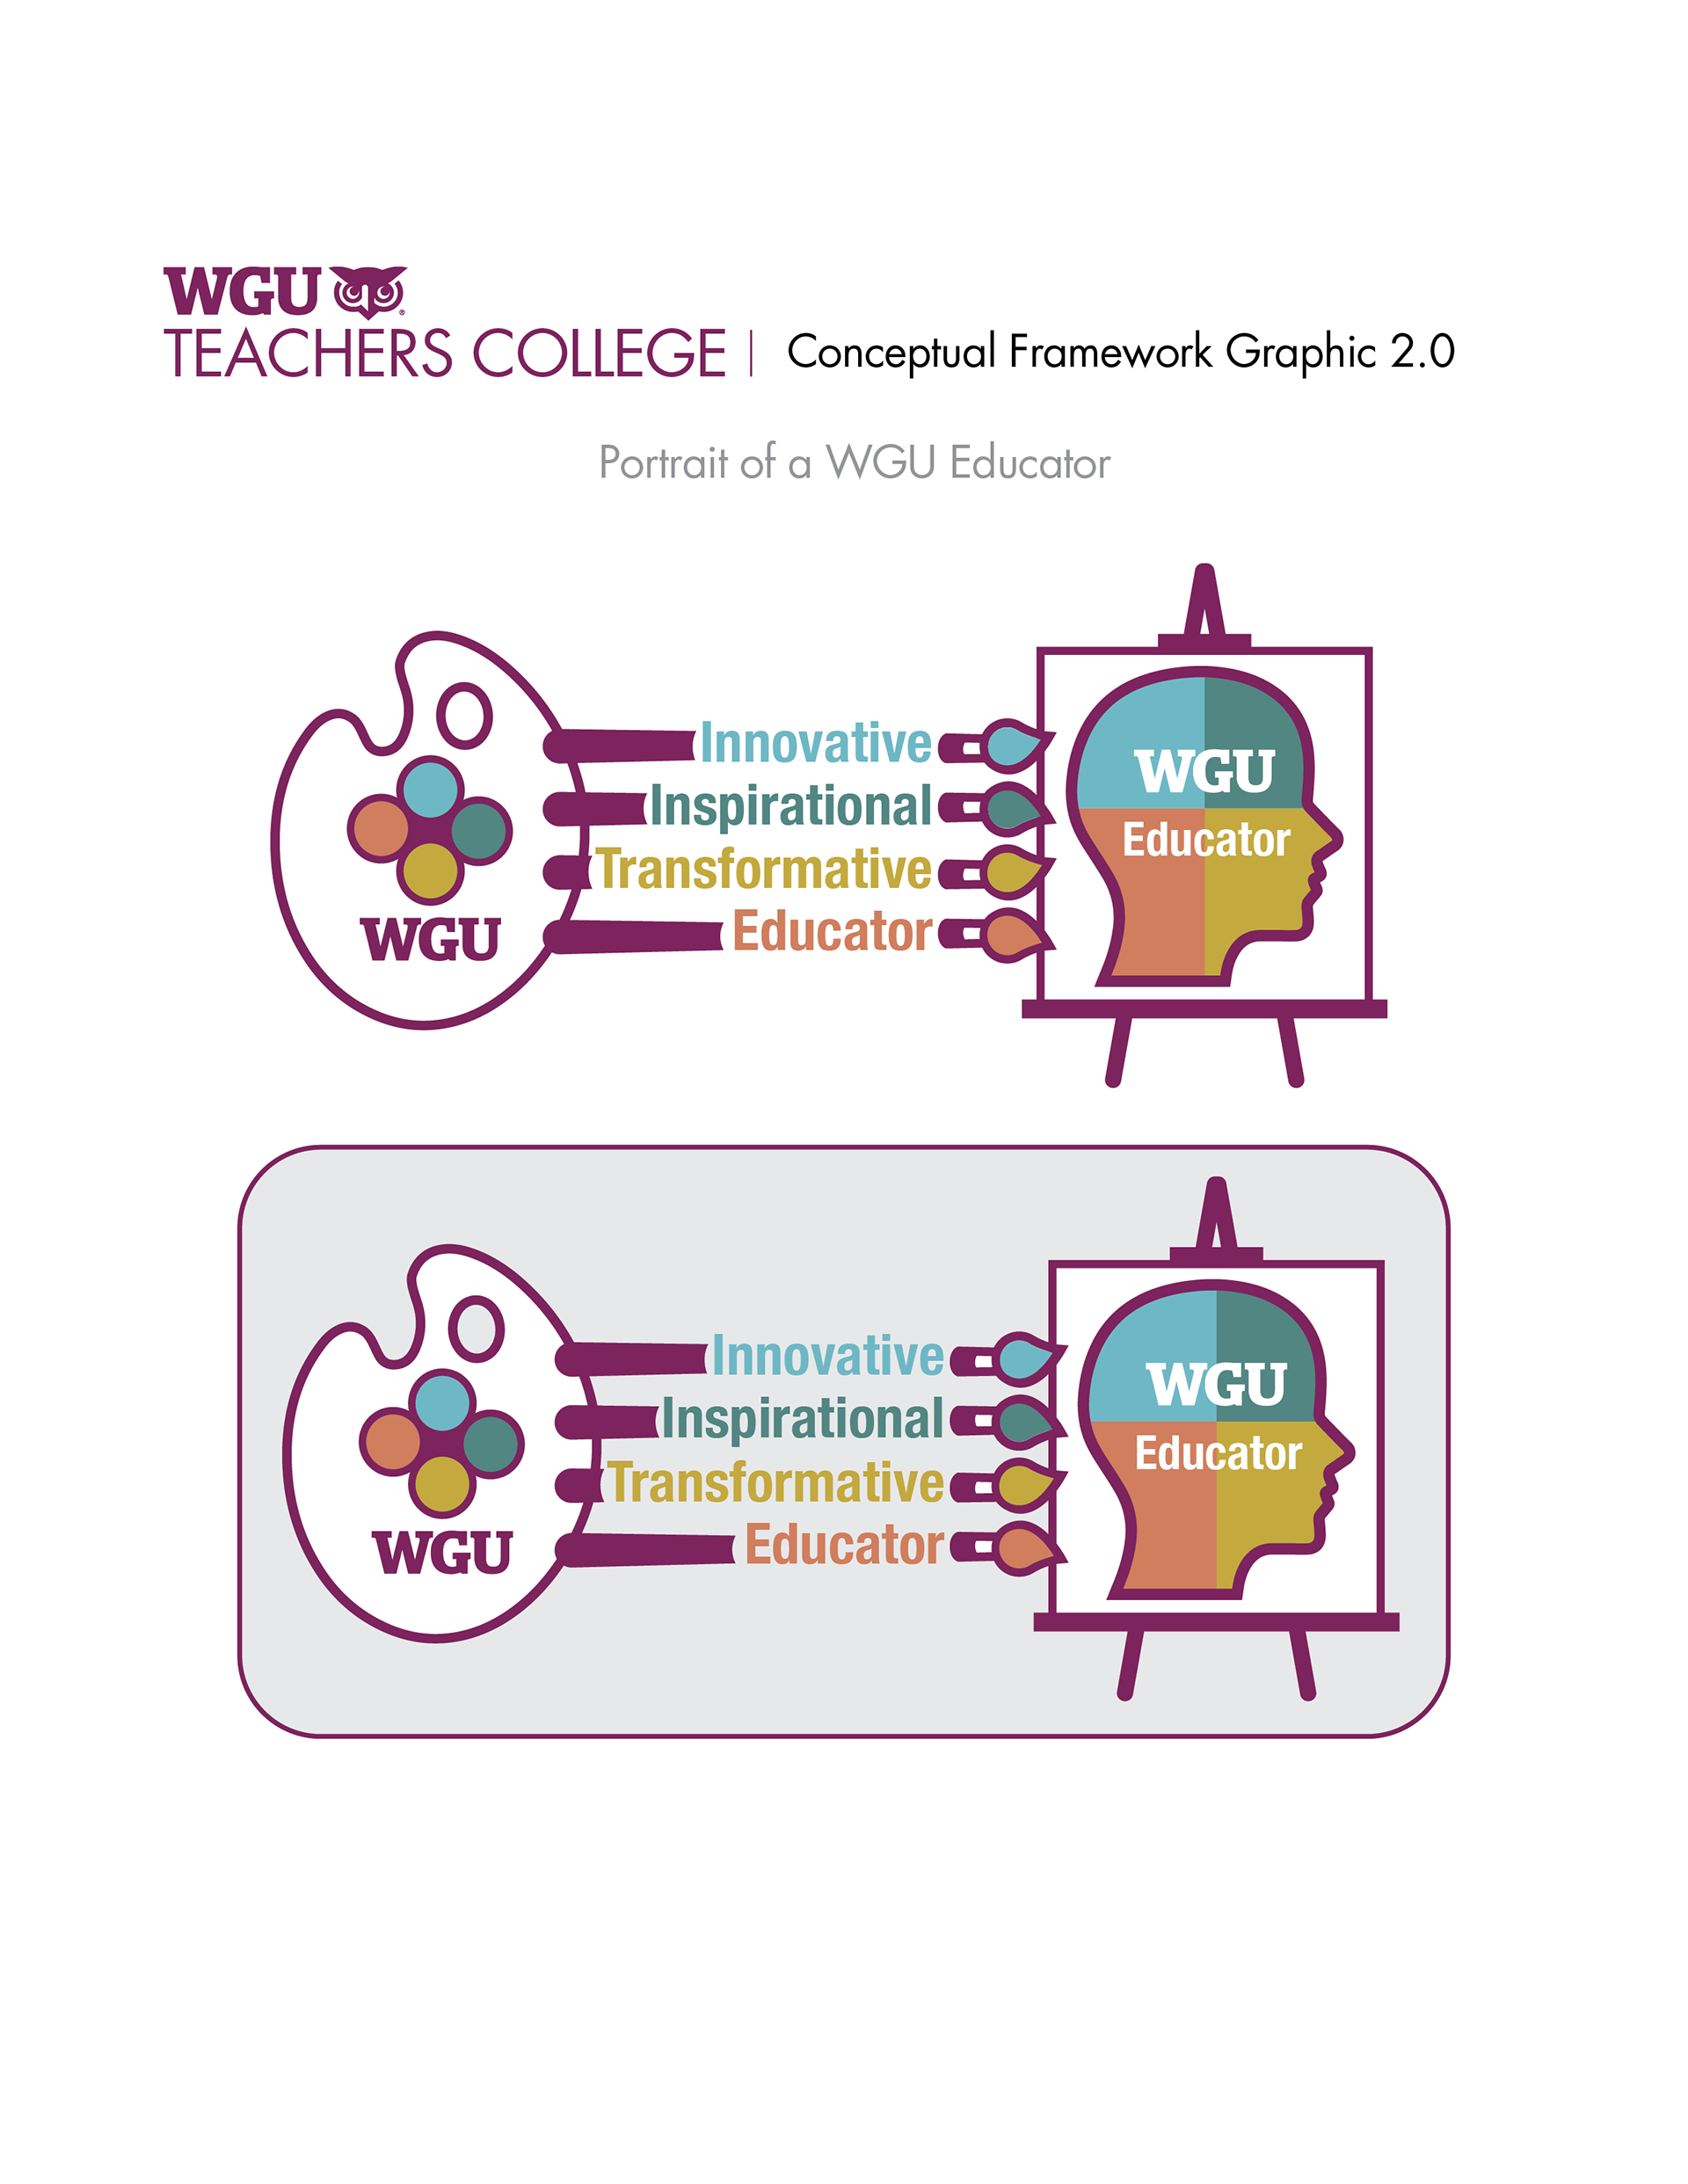
WGU leads all higher education institutions in the U.S. in graduating teachers (5.2%), making it essential to define their school of education's business model and brand. I created the graphic above to represent the profile of a WGU educator.
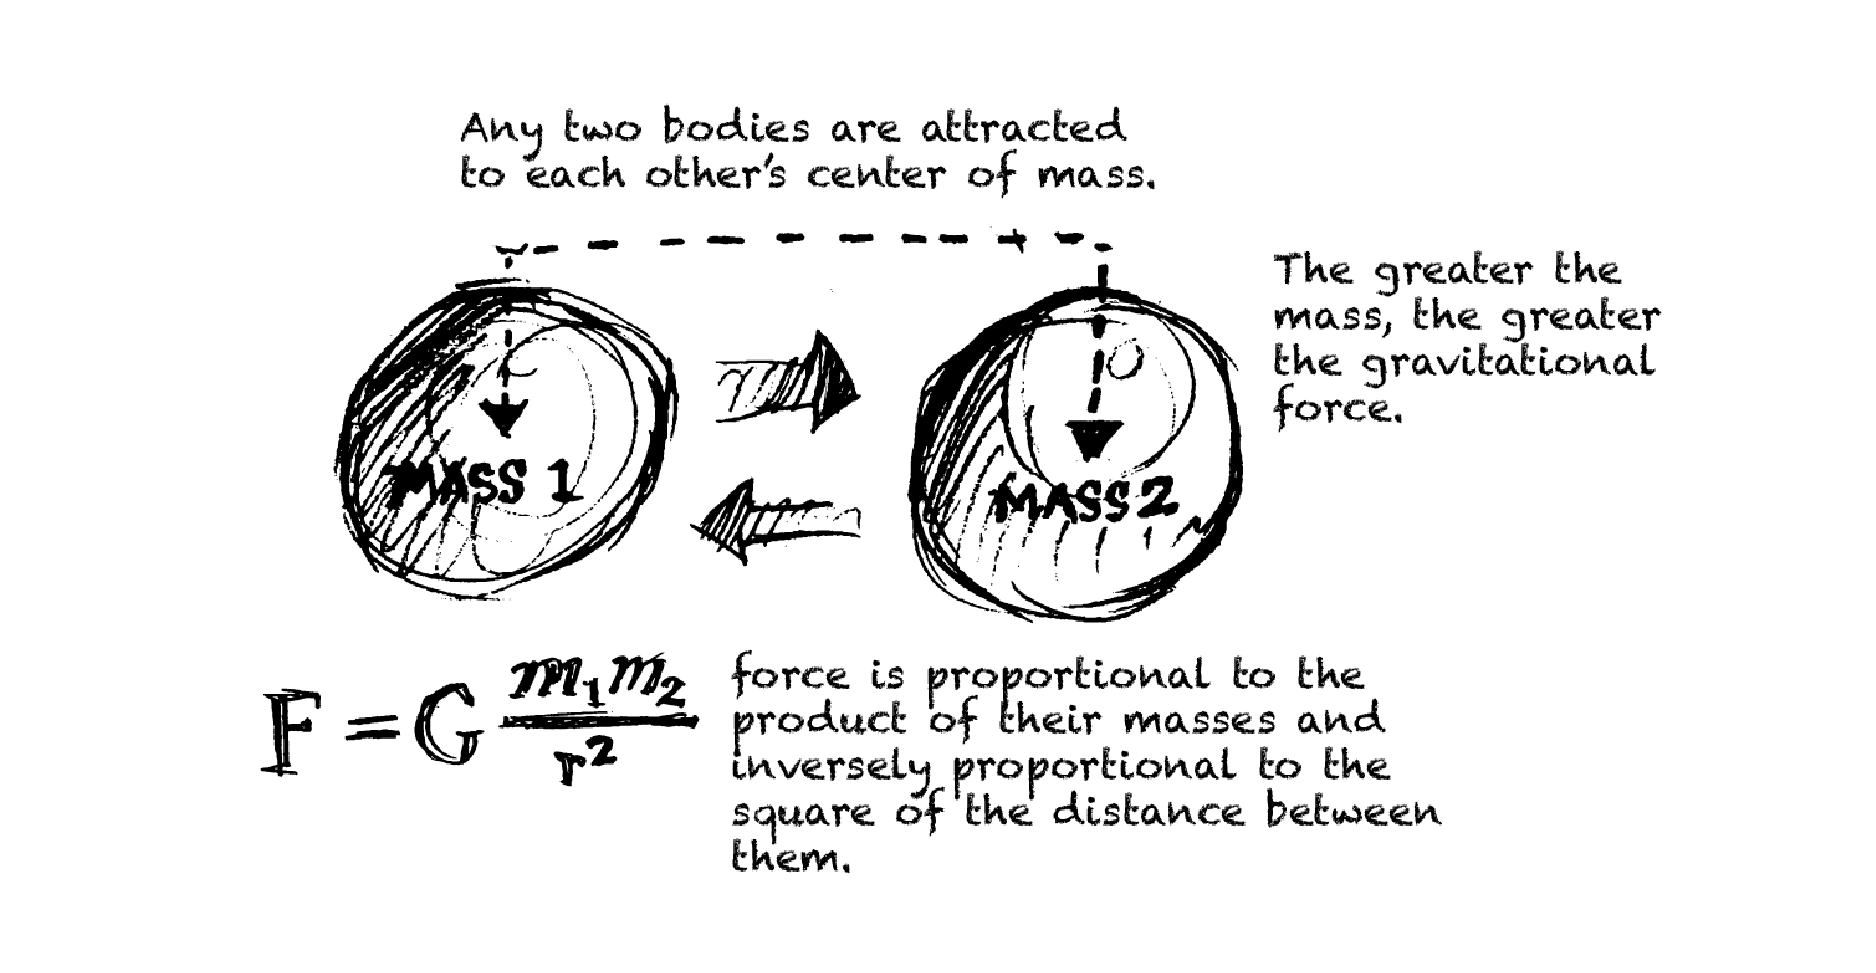
Linking mass and gravitational pull legacy thinking.
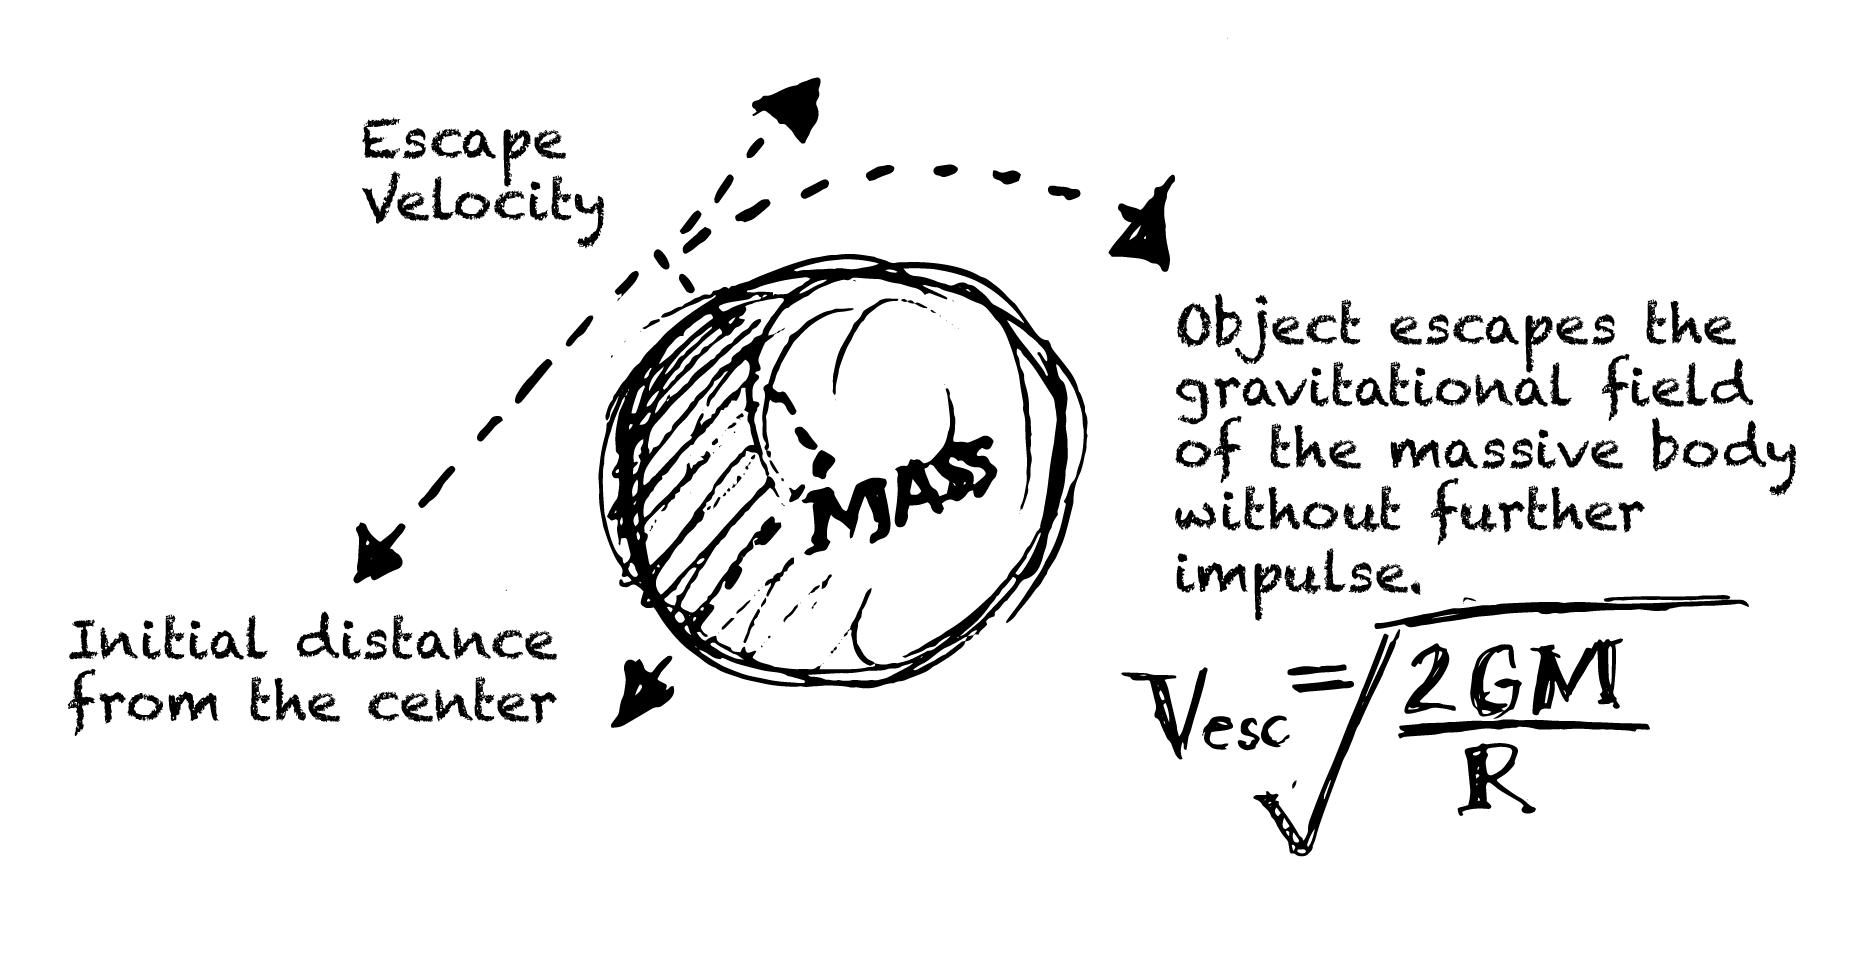
Linking velocity to breaking free of legacy thinking.
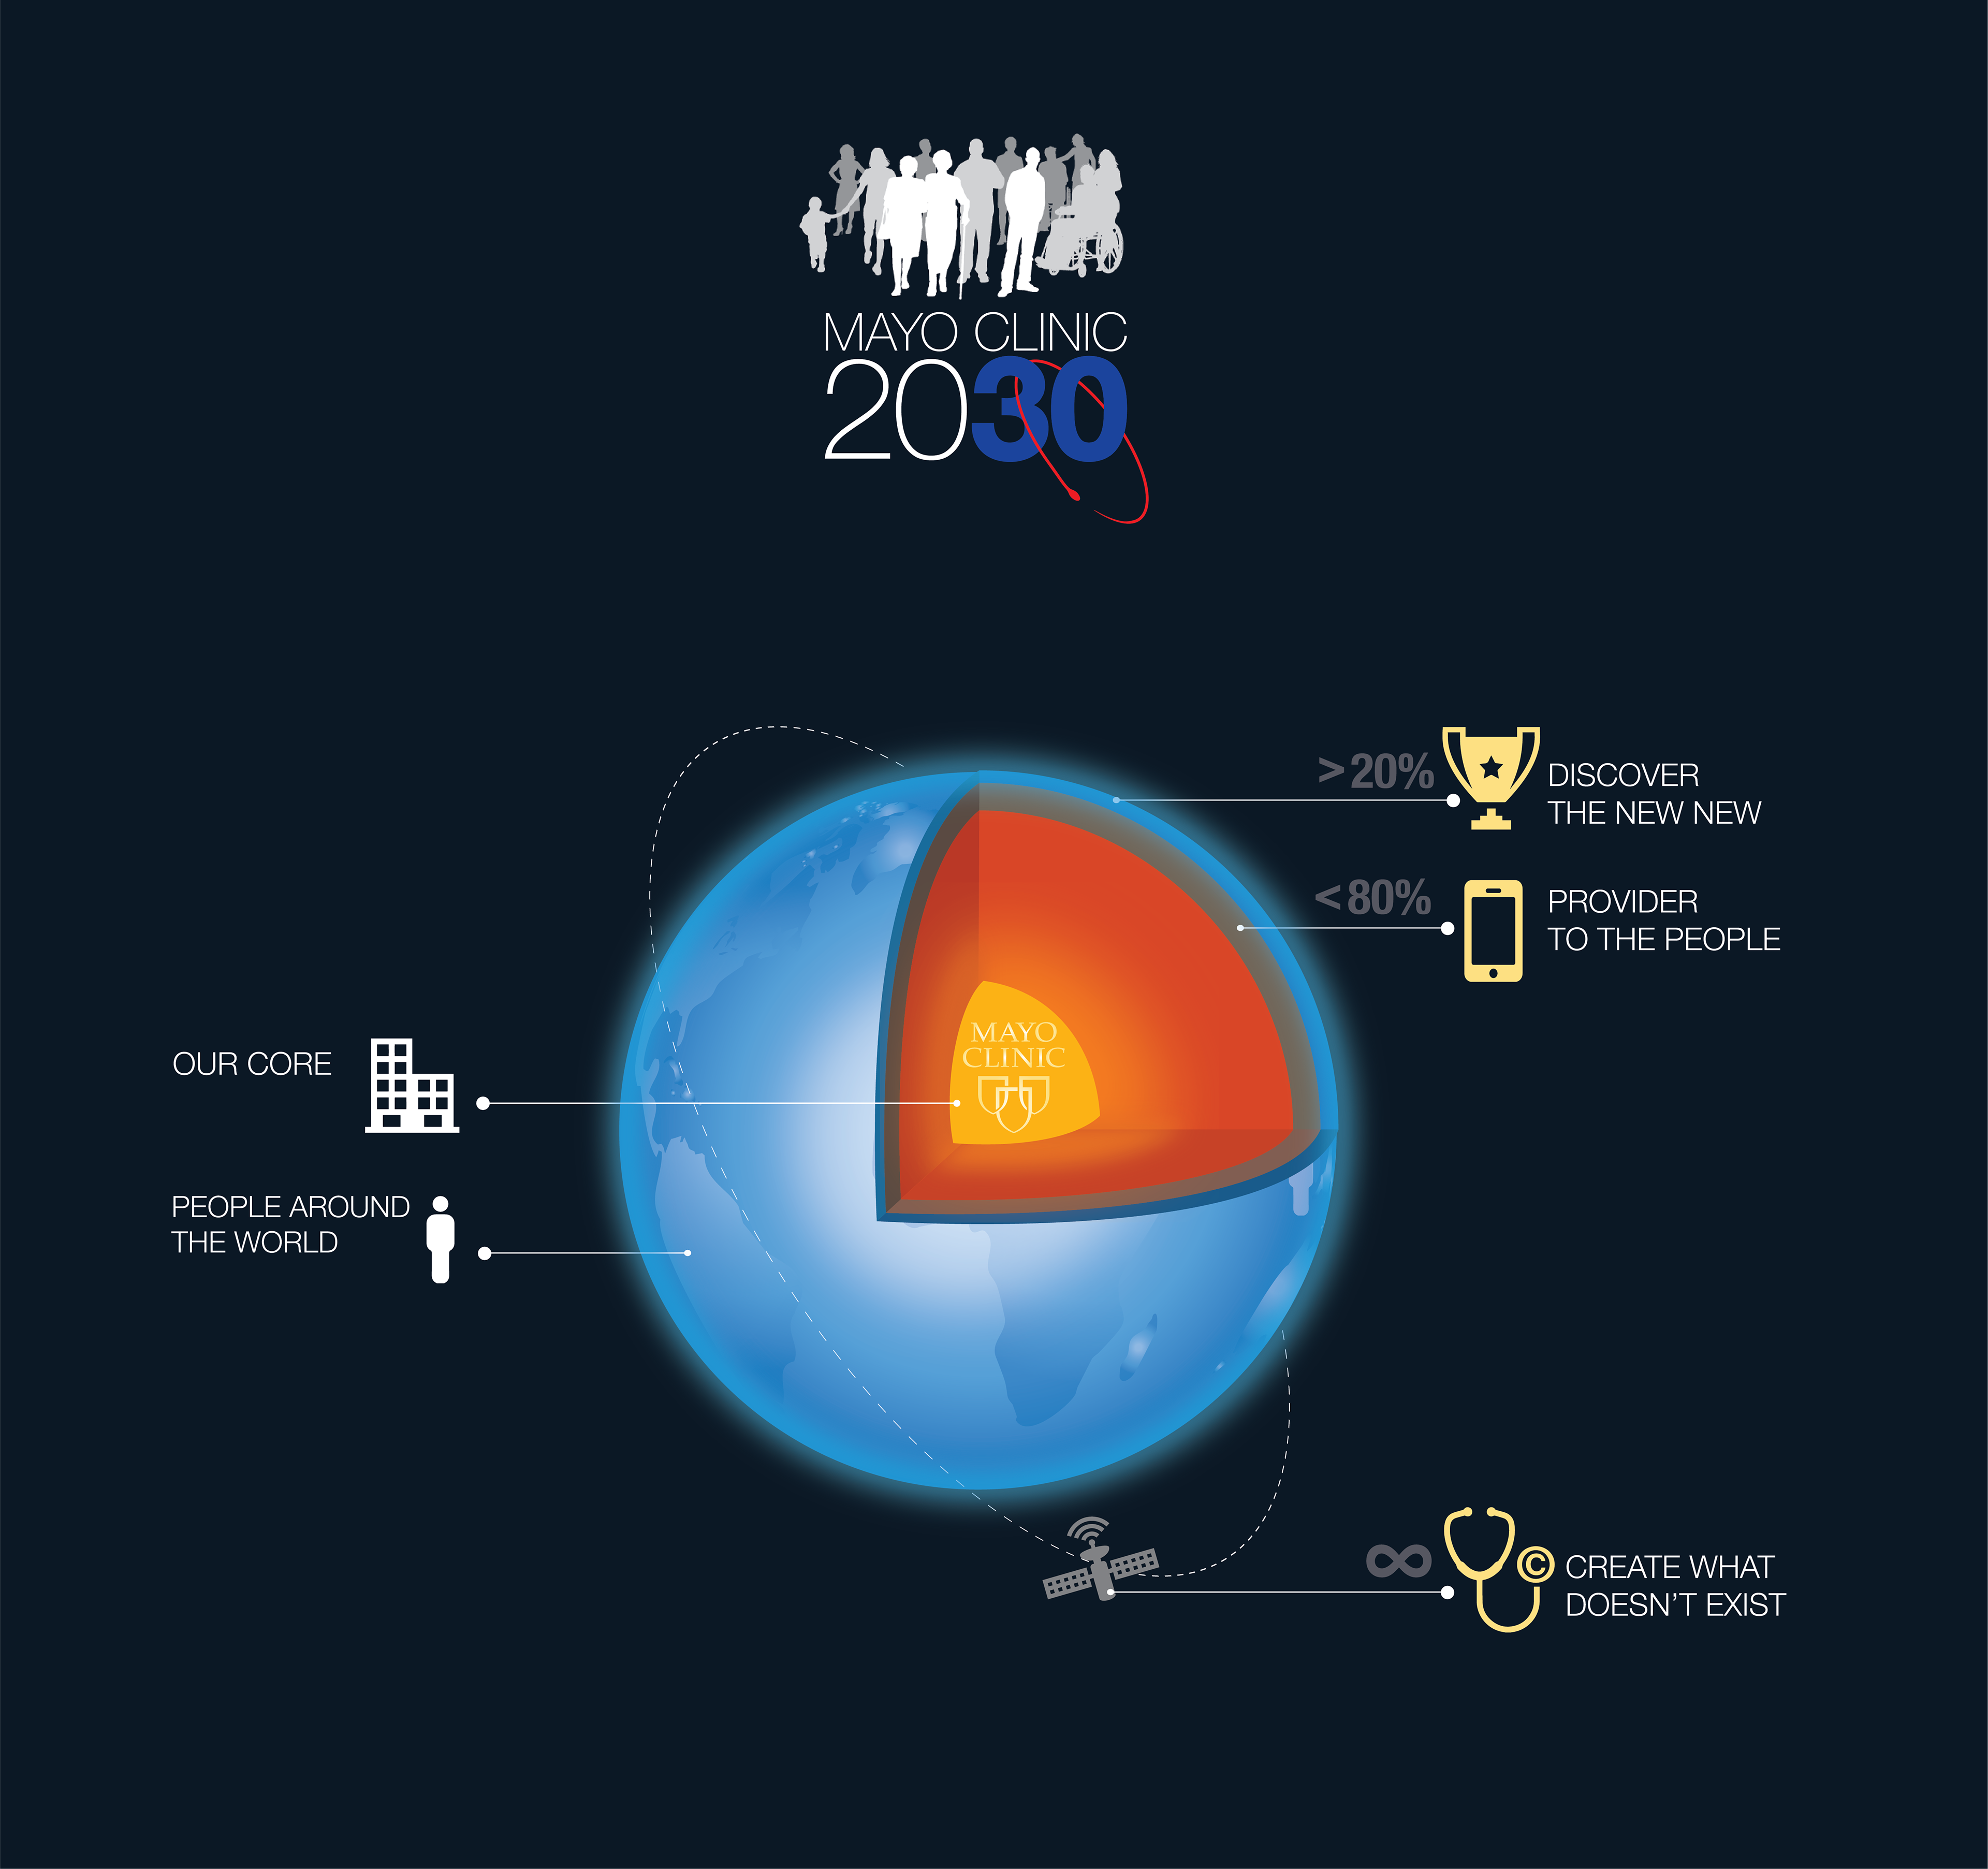
A more global mindset.
While working at Fuse, I was contacted by the Office of Planning at Mayo Clinic to help develop vision concepts for Mayo Clinic 2030. To facilitate understanding and gain support for a broader vision, I first created sketch visuals illustrating the concepts of gravitational pull and escape velocity, which were central to my finished concept above.

When expectations aren't met, a service expectation gap is created.

Staff should close the expectation gap quickly

Speed is important for service recovery to be effective.

The negative experience multiplier is the silent killer of a brand.
I leaned heavily on infographics to tell the service recovery story for Olmsted Medical Center. Visualizing the experience multiplier was an eye-opener.
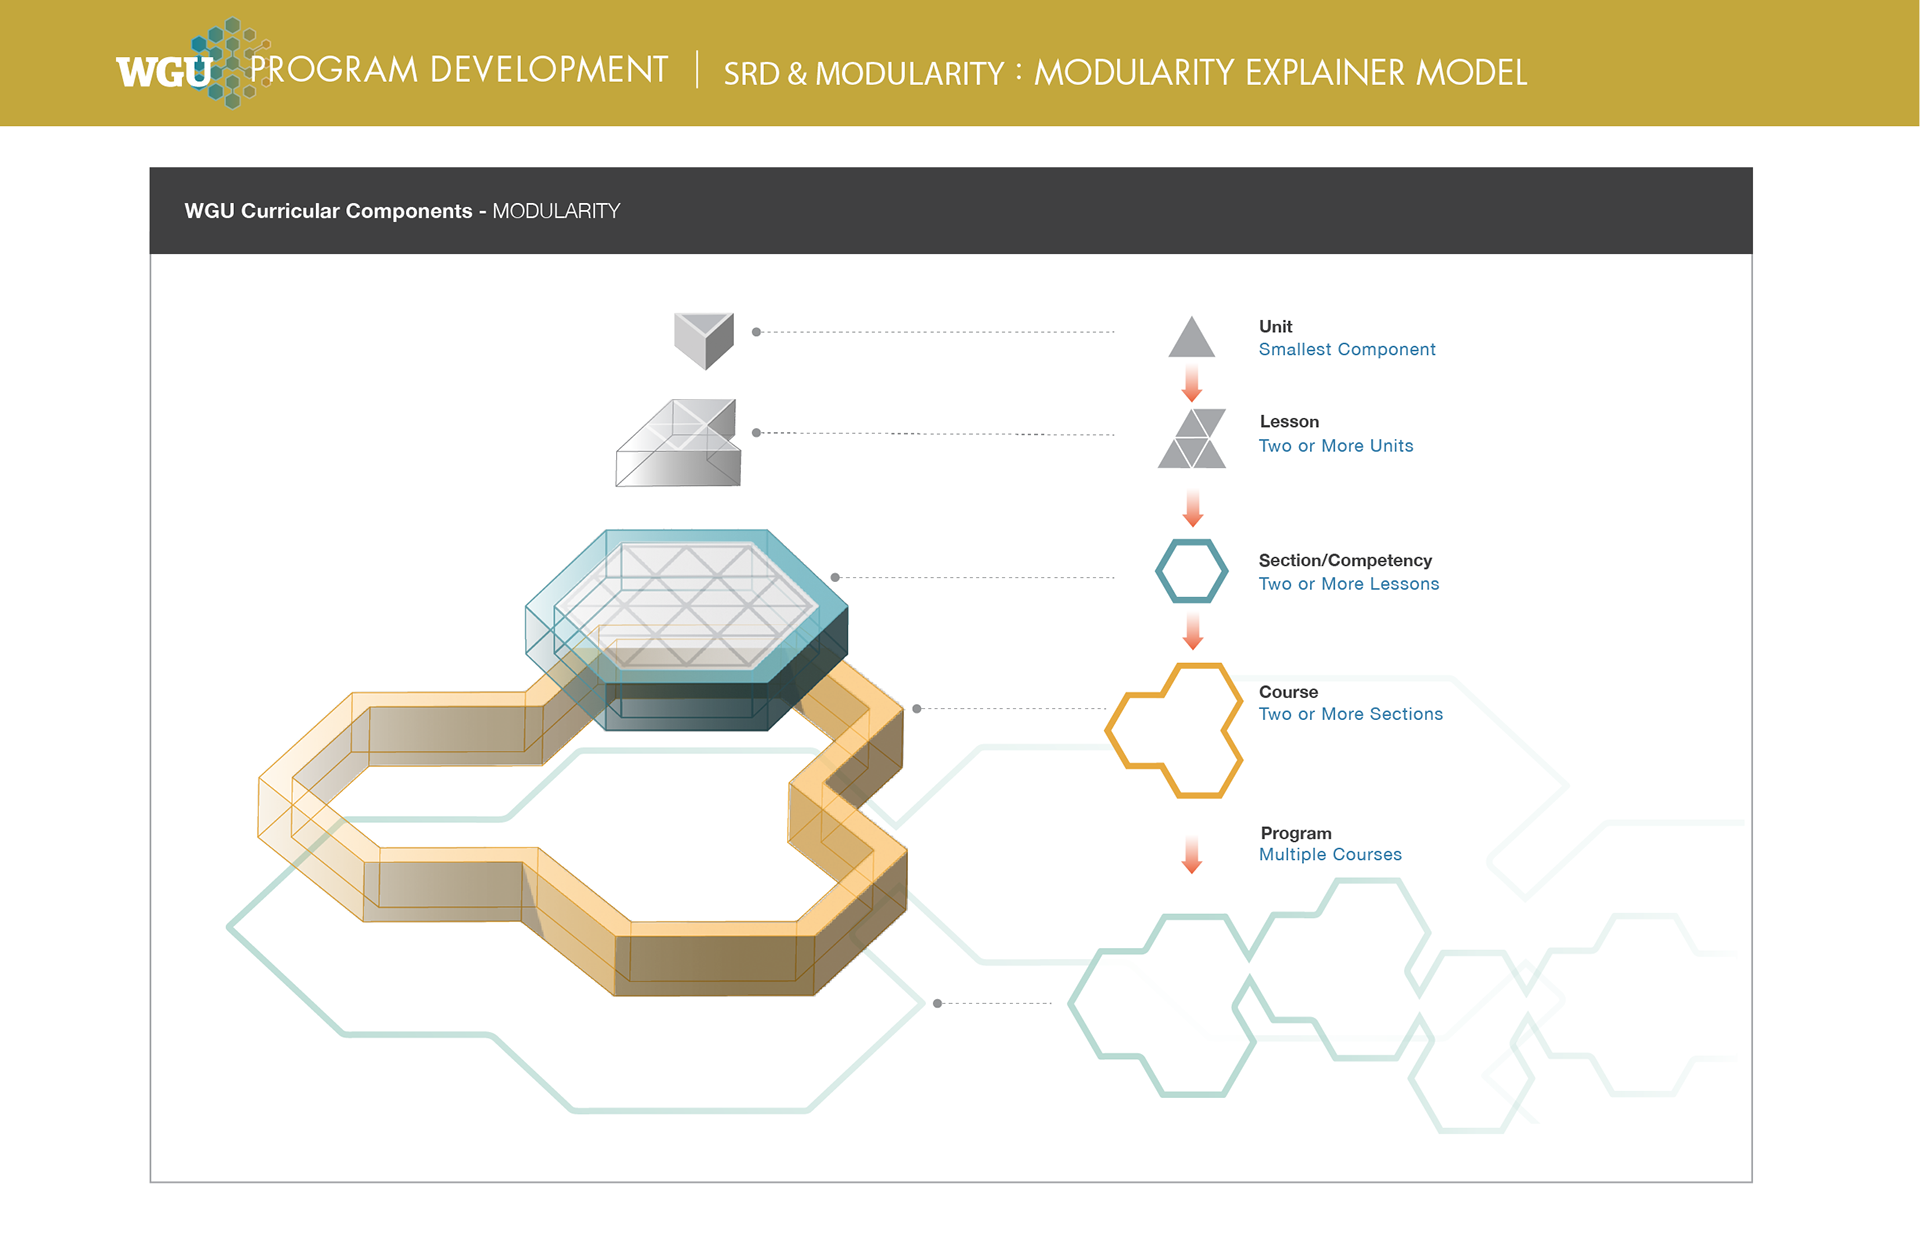
Basic structures of WGU's educational products.
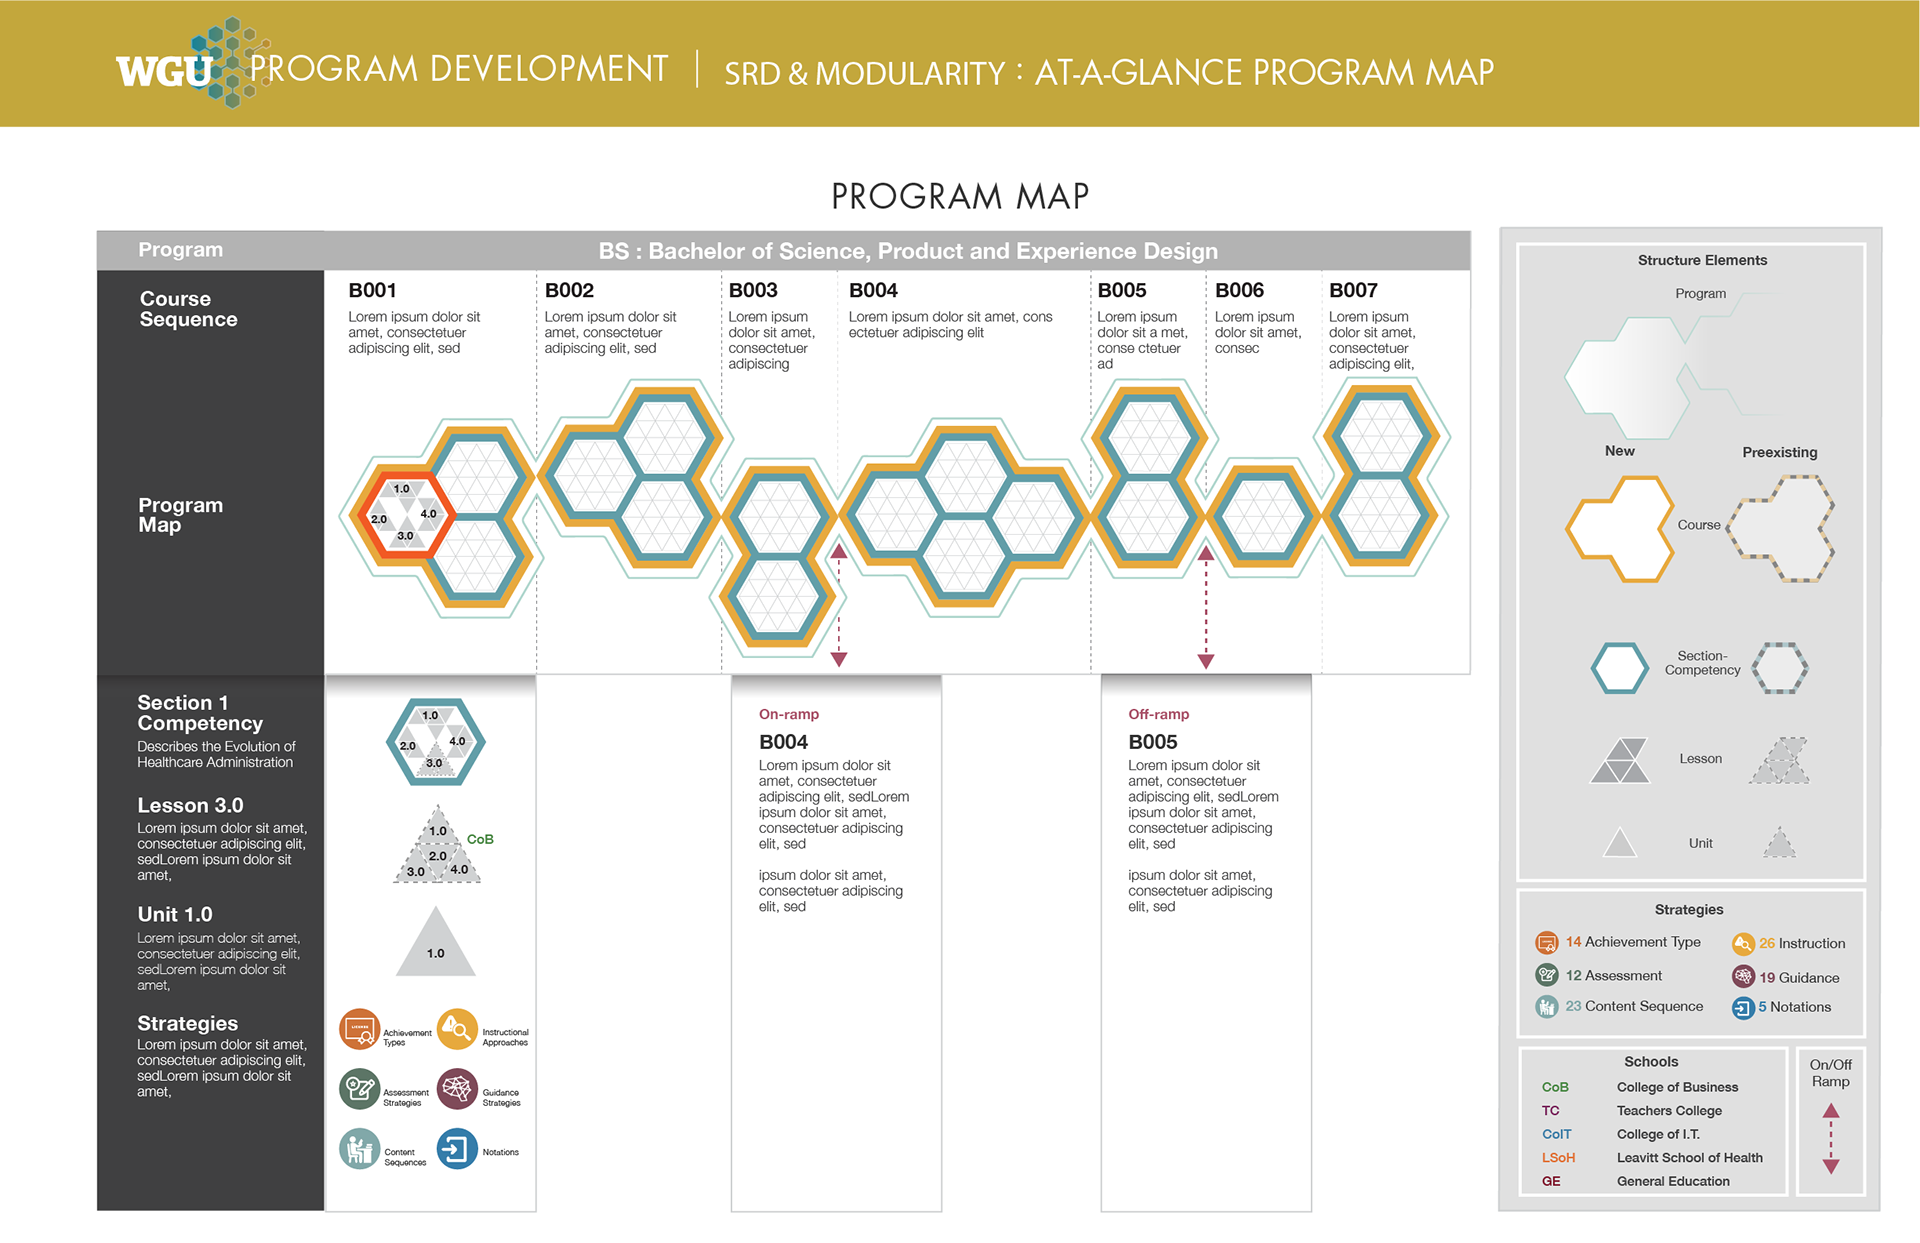
Modularity creates reusable courses and course elements.
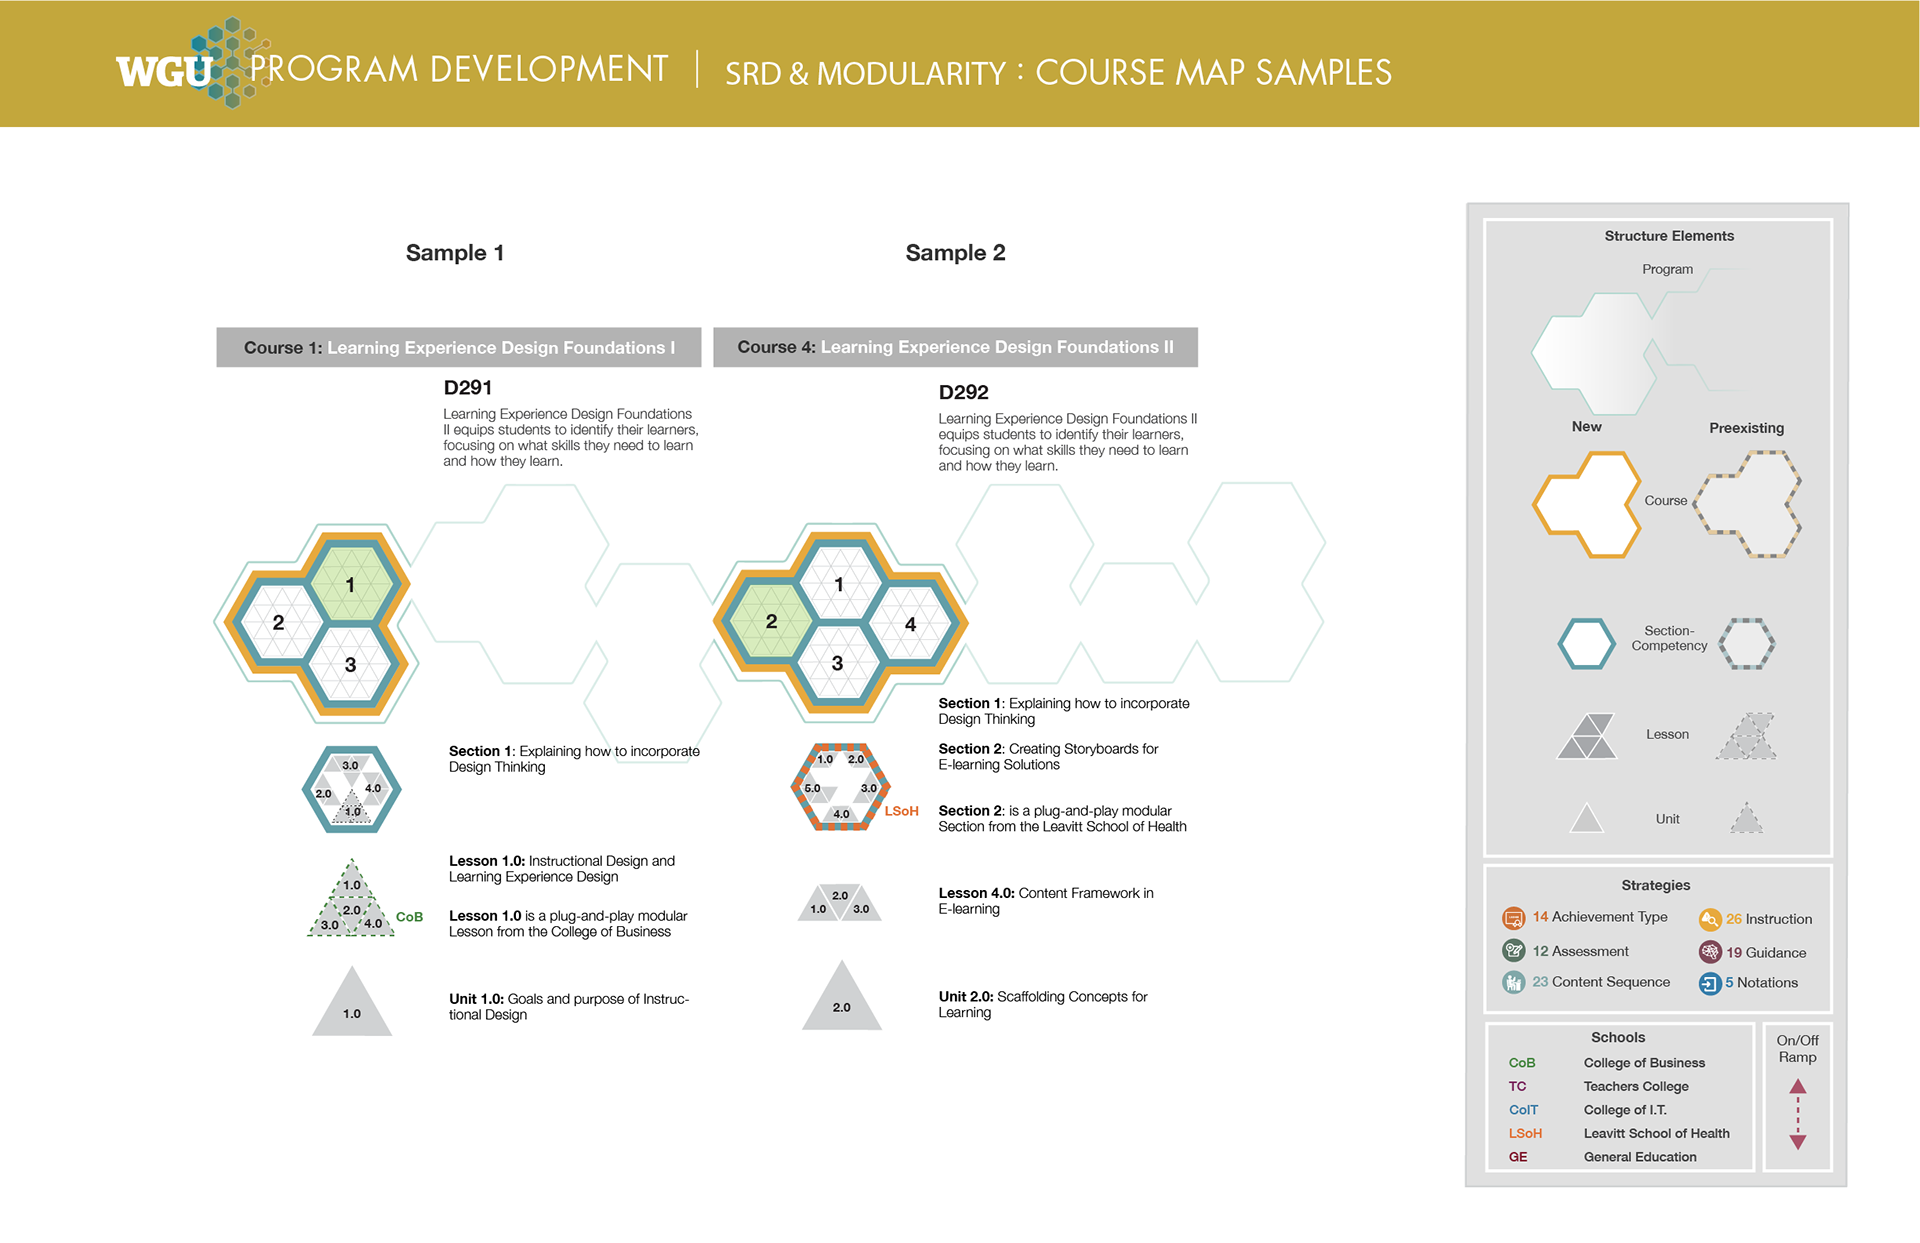
Modularity applied to courses.
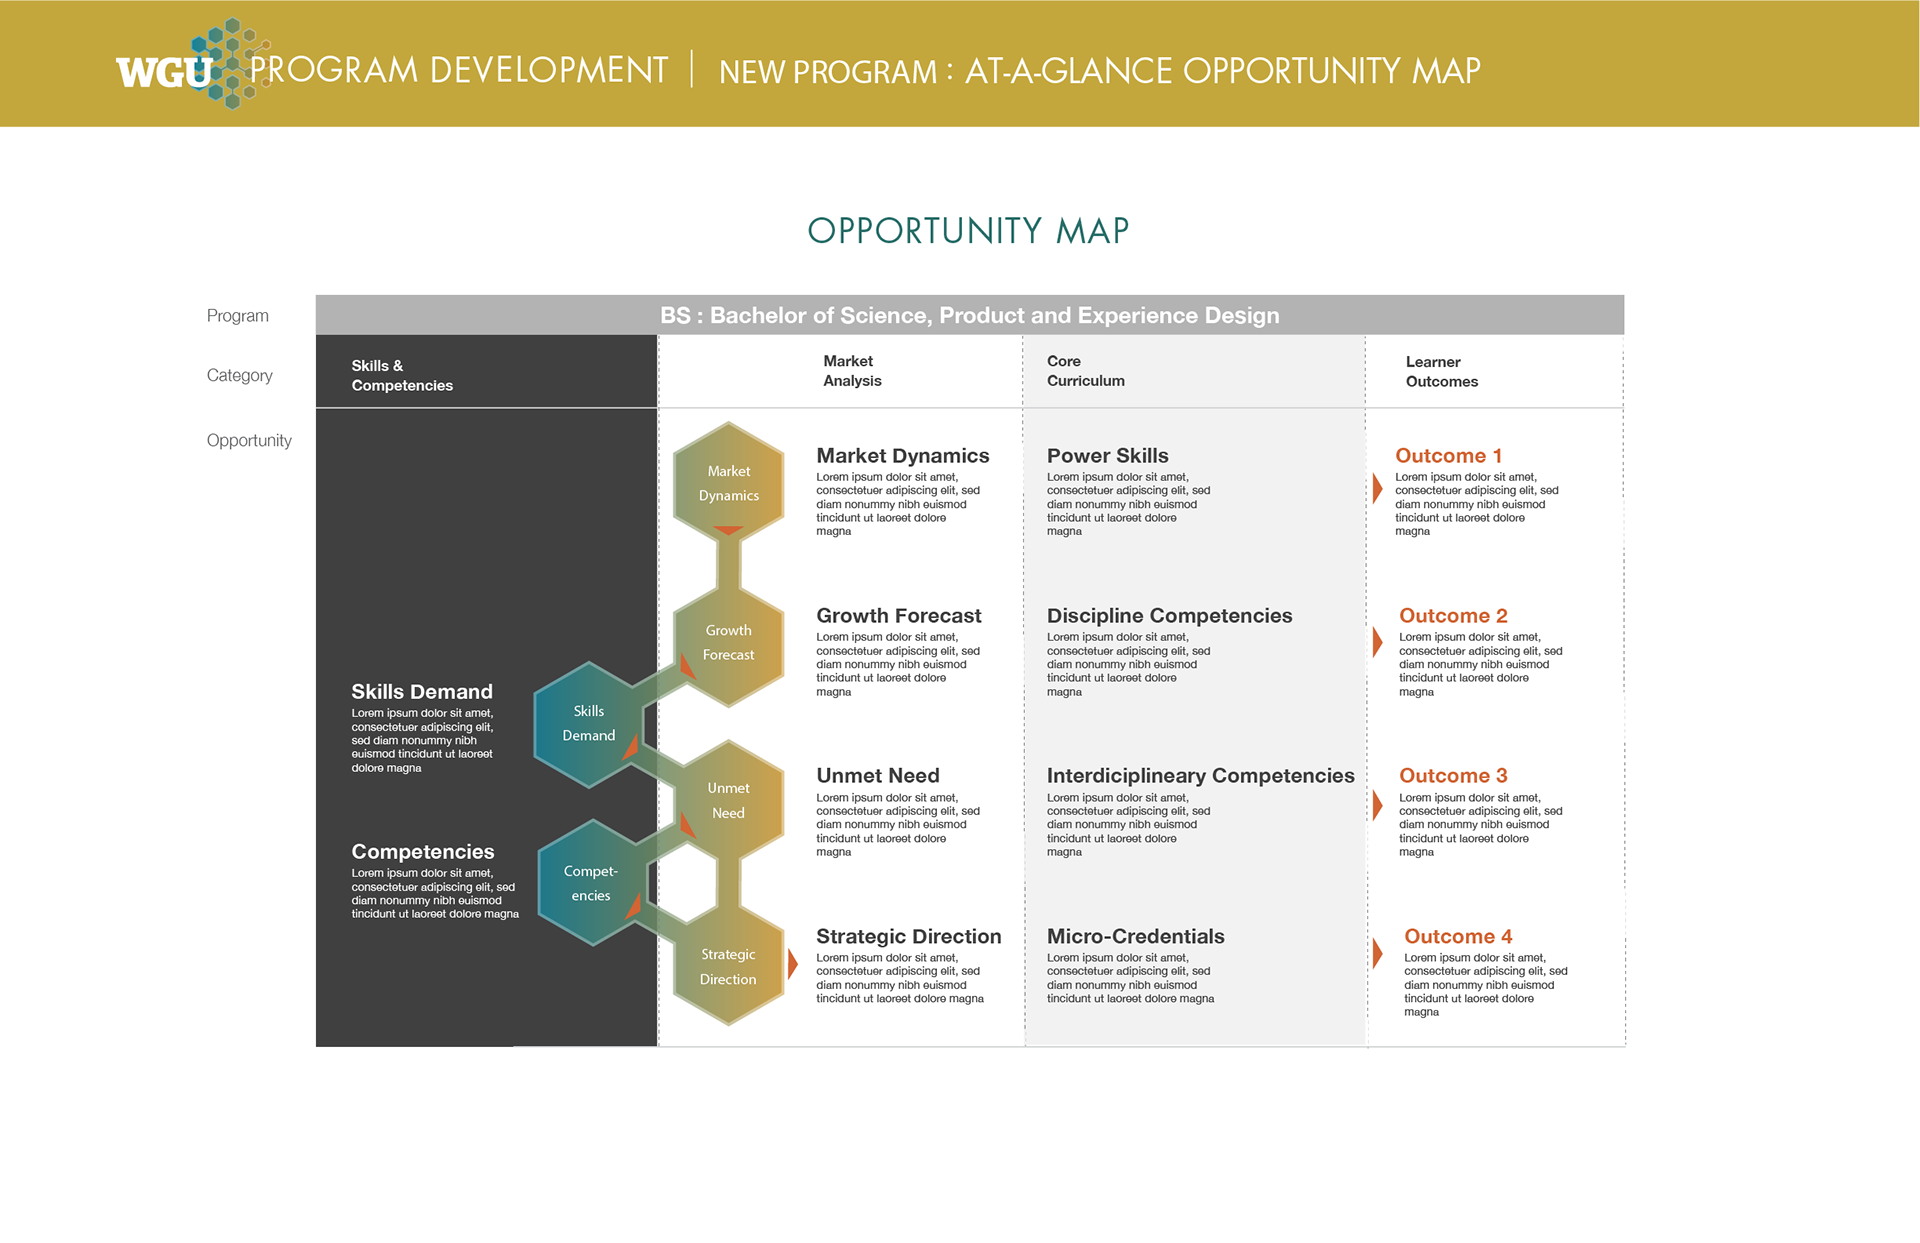
The opportunity map.
Working alongside our Program Design Lead in WGU's Standards and Practices, I created the visual system to help other departments in the institution understand modularity in course design.